Current Trends in U.S. Hydrogen Policy

By: Rebekah de la Mora, Policy Analyst

With the passing of the Infrastructure and Investment Jobs Act of 2021, $8 billion dollars worth of focus was placed on the most abundant element in the universe: hydrogen. Specifically, hydrogen used for energy purposes. Some may know a significant amount about hydrogen energy; some may know of it only through the disastrous Hindenburg accident of the 1930s; and some may know nothing at all. Some find it to be a waste of time and resources, some find it to be a key solution in the fight against climate change, and some find it to be a solution like any other. Hydrogen is not as in the public sphere as energy sources like natural gas, wind, or solar, but discussions surrounding it are becoming more and more prevalent.

What is Hydrogen Energy?

While hydrogen is always made of the same component -- H2 molecules -- the ways to get there vary. When talking about said ways, they are categorized by color. The colors refer to the process used to make the hydrogen and the energy source, or "feedstock." Black, brown, and gray hydrogen refer to steam methane reformation or gasification using coal or natural gas/methane; blue hydrogen is the same, but with the addition of carbon capture and storage. Green hydrogen refers to electrolysis using renewably-sourced electricity; pink or purple hydrogen also uses electrolysis but with nuclear-sourced electricity, while yellow hydrogen is specifically solar-sourced electricity only. Turquoise hydrogen refers to methane pyrolysis using natural gas/methane; this method is not yet at-scale. White hydrogen refers to naturally-occurring or fracking-created hydrogen that is "mined" for use; this method is more theoretical and not yet in practice. Policies on decarbonization-via-hydrogen tend to focus on green hydrogen, with blue hydrogen also relatively popular. Many policies may use the phrase "clean hydrogen," which often implies green, pink/purple, yellow, and occasionally blue.

The end-uses of hydrogen vary, and do not depend on the color. Overall, its uses fall into three main categories: replacing carbon-intensive sources of energy, a component in product manufacturing, and energy storage. First, hydrogen can be used as an alternative fuel in transportation; depending on the exact technology, hydrogen-powered vessels like boats or heavy-duty trucks are more feasible than electric versions. Hydrogen can also be used to decarbonize various industrial processes, particularly hard-to-decarbonize sectors like steel. Hydrogen can even be blended with natural gas for heating purposes. Second, hydrogen is a major component in ammonia and fertilizer production for agricultural use. Third, hydrogen can be used as a form of energy storage, "storing" electricity until it is needed, at which point the hydrogen undergoes reverse electrolysis to generate electricity. Hydrogen is often seen as a solution for long-term or long-distance storage; for example, storing solar power from summer to be used in winter, or importing green hydrogen from another country to provide renewable energy.

Hydrogen in State and Federal Policy

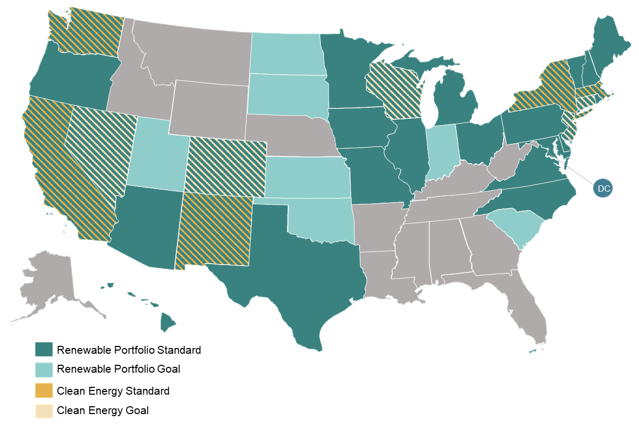
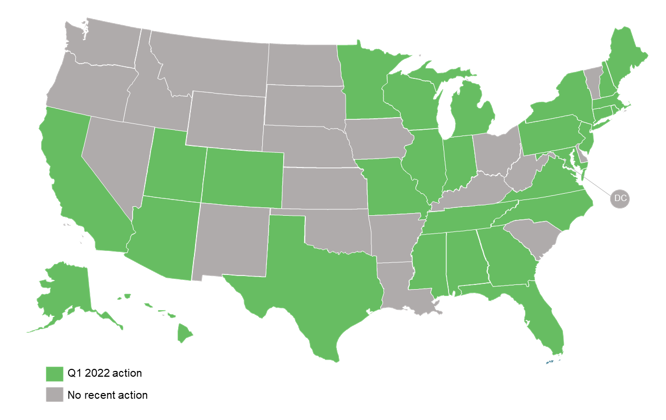
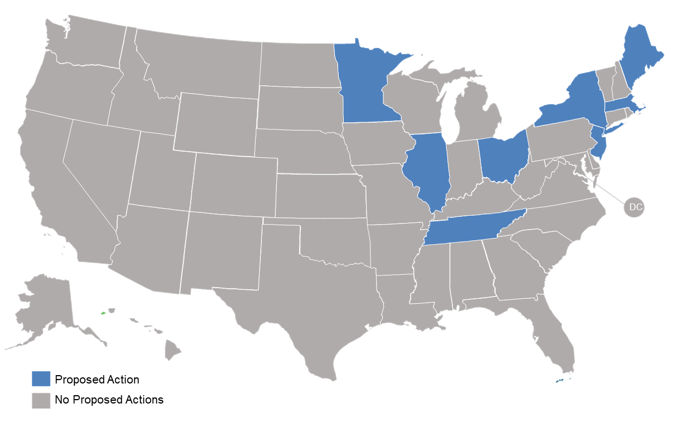
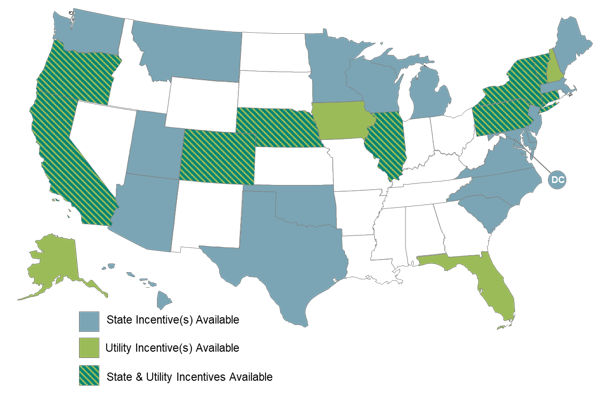
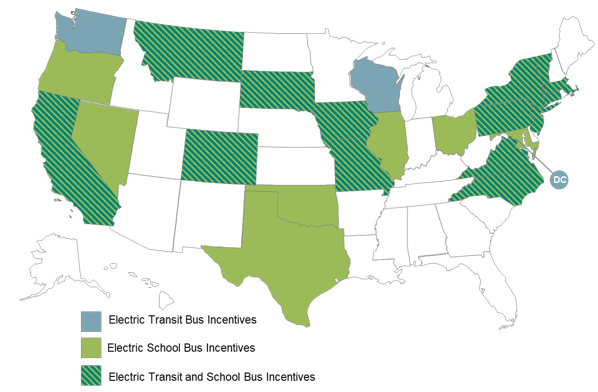
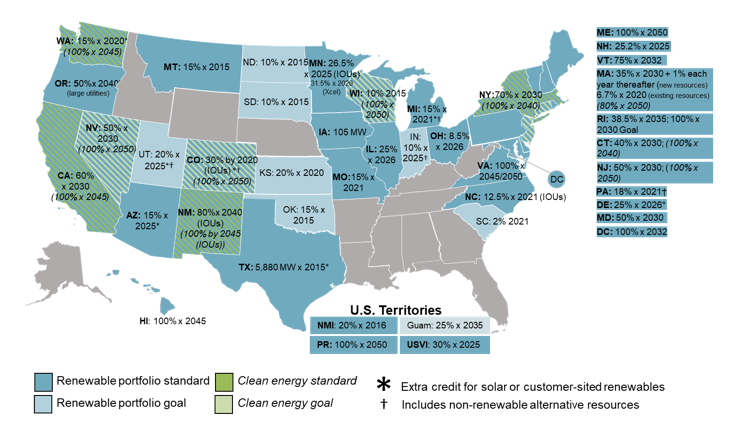
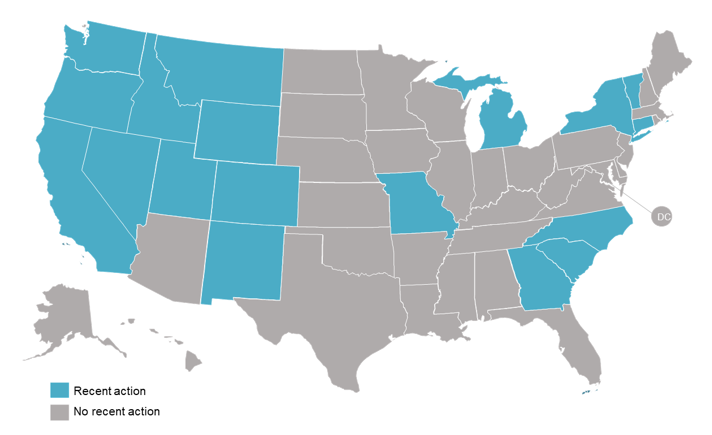
At the subnational level, many states are attempting to include hydrogen in their clean energy policies. One of the easiest actions is including appropriations for hydrogen in state budgets. Hydrogen is often integrated into alternative fuels or electric vehicle programs, from providing incentives for fuel cell cars to encouraging development of heavy-duty hydrogen vehicles. In conjunction with the regional hubs initiative, many states are establishing studies, working groups, or committees to look at hydrogen infrastructure and feasibility. Hydrogen is also being included in policies related to GHG reductions and transportation decarbonization, specifically clean hydrogen; energy targets are also incorporating clean hydrogen or hydrogen from renewable sources as an eligible energy source.

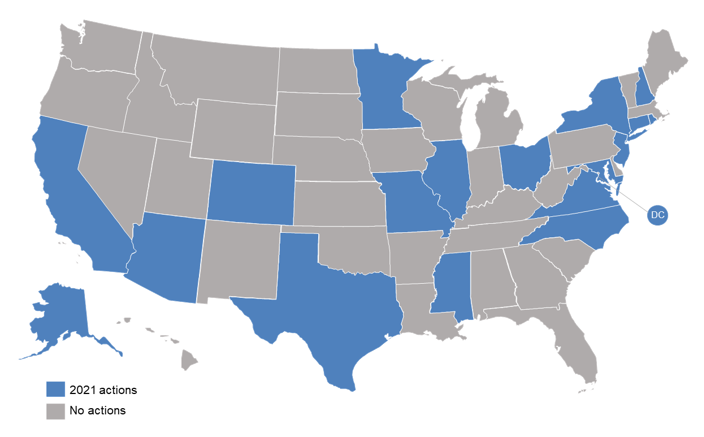
At the national level, the Infrastructure and Investment Jobs Act of 2021 provides $8 million in DOE funding to develop regional hydrogen hubs across the US. The money is expected to fund 4-8 regional hubs. The law requires that the hubs vary their feedstocks, end-uses, and geography to ensure a variety of hydrogen frameworks are put into practice. Many states have begun collaborative efforts to receive the funding, signing agreements or memorandums with neighboring states and organizing groups to respond to DOE's Request for Information on the subject. At least 18 states have officially declared their intentions to pursue the funding, of which there are 4 regional agreements: Arkansas, Louisiana, and Oklahoma; Colorado, New Mexico, Utah, and Wyoming; Connecticut, Massachusetts, New Jersey, and New York; and North Dakota and South Dakota. The other states have declared their intent, but have not signed an agreement with other state governments to pursue a joint regional hub. Some states have expressed interest via stakeholder workshops or private-sector interests, like the Southeast Hydrogen Energy Alliance in the Carolinas, but have not yet officially declared their intentions. The application period is expected to open in Fall 2022.

The hydrogen economy is slowly gaining ground as private and public sector interests look for alternatives to fossil fuels; it is an especially notable solution for hard-to-decarbonize sectors or places with low possibilities of renewable energy integration. While hydrogen is not yet as ubiquitous as traditional renewable technologies, nor has the same level of resounding support, the growing prevalence of hydrogen in energy policy demonstrates a trend that is here to stay.

Electric Power Decarbonization: State Policies and Recent Actions

By: Autumn Proudlove, Sr. Policy Program Director

States continue to be very active on clean energy policy, with a growing focus on overall decarbonization of the electric power sector. Some of the most popular policy approaches to electric decarbonization are renewable portfolio standards, clean energy standards, and emissions reduction targets. Currently, 36 states and DC have a renewable portfolio standard or goal, while 10 states have a clean energy standard or goal. Numerous states have also adopted requirements or goals to reduce carbon or greenhouse gas emissions by a certain percentage. Some of these emissions reduction policies apply to the electricity sector specifically, while others apply economy-wide.

State Renewable Portfolio Standards and Clean Energy Standards

Recent Activity

A number of states have recently considered legislation to increase their decarbonization targets or set new targets. The Hawaii State Legislature passed H.B. 1800 this year, which would adopt a statewide greenhouse gas emissions reduction target of 50% over 2005 levels by 2030. The bill is currently awaiting action by the Governor. In Rhode Island, H.B. 7277 and S.B. 2274 would increase the state’s renewable portfolio standard to 100% by 2033. The bills have been passed and are also awaiting action by the Governor. The Maryland General Assembly enacted the Climate Solutions Now Act of 2022 (S.B. 528) in April 2022, which adopts a target of net-zero statewide greenhouse gas emissions by 2045.

Current Clean Energy Generation by State (Data Source: U.S. Energy Information Administration)

Current Clean Energy Generation

The amount of electricity being generated by clean sources varies significantly from state to state. The map above shows the percentage of electricity generation currently coming from clean energy sources, with data derived from the U.S. Energy Information Administration (Electric Power Monthly, Net Generation by State by Type of Producer by Energy Source, March 2022). The map represents the percent of total MWh generated in each state from nuclear, hydroelectric, solar, wind, biomass, and geothermal sources. The dominant clean energy resources also vary substantially from state to state. For example, hydropower is a major contributor in the Northwest and wind accounts for a large portion of generation in the Midwest and Plains states.

While states are at different stages of electric power decarbonization, the general policy trend across the U.S. has been toward more aggressive targets - increasing emission reduction or clean energy goals and speeding up the timeline for achieving these. Utilities themselves are also setting their own goals, as identified by the Smart Electric Power Alliance’s Carbon Reduction Tracker. With the majority of states having some type of a decarbonization target in effect, even many 100% clean energy or net-zero emissions goals, integrated resource planning and market rules will be important areas to watch as implementation of these policies unfolds.

* * *

The DSIRE Insight team is currently developing a new policy tracking report series - The 50 States of Decarbonization - which will track state decarbonization policy developments and utility planning. Sign up for our email list to be the first to know when the new series is available, or contact us to learn more.

Recent Developments in Managed Charging

By: Brian Lips, Sr. Policy Project Manager

A record 434,879 electric vehicles (EVs) were sold in the U.S. in 2021. Facing growing demand, manufacturers continue announcing new models to further electrify the transportation sector. This surging market will surely help states meet their climate goals, and open new business opportunities for electric utilities. But could a new source of electricity demand be more of a detriment to utilities, which, in some states, already have challenges meeting their peak demands? The California Energy Commission, for example, projects EV charging will add an additional demand of nearly 1,000 MW before 8:00 PM on top of the already challenging duck curve.

With no other market interventions, EV owners who commute to work could be inclined to charge their vehicles when they return in the late afternoon and exacerbate these growing demand curves. However, with proper incentives or more direct utility involvement to shift the EV demand curve, EV charging could provide a myriad of benefits to consumers and the electric system as a whole. While the EV industry and its effects on the grid are still very new and vary from state to state, utilities have started exploring different approaches to influence customer charging behavior, commonly referred to as managed charging.

Q1 2022 State and Utility Action on EV Rate Design & Managed Charging

The Smart Electric Power Alliance draws a distinction between active and passive managed charging, which are analogous to the existing utility approaches to managing demand generally. Passive managed charging uses price signals like time-varying rates or peak time rebates to encourage customer behavior, while active managed charging gives utilities direct control over the load similar to a demand response program.   

The 50 States of Electric Vehicles quarterly report series tracks ongoing efforts by state policymakers and utilities to expand the market for EVs, including proposals from utilities for managed charging programs. To date, the majority of utility proposals identified in the 50 States of Electric Vehicles reports have been passive managed charging. But several utilities have taken action in recent months to roll out active managed charging programs.  

Duke Energy filed an application with the North Carolina Utilities Commission in February 2022 for a new managed charging pilot program. The pilot program combines a fixed monthly subscription rate for residential EV charging with a managed charging element. Customers will be able to charge their vehicle whenever and however often they like, but will receive a warning from Duke if they consume more than 800 kWh in a month. Meanwhile, Duke will have the right to pause a customer’s charging for up to four hours three times per month. Duke believes customers will be attracted to the predictability of a set monthly fee, while the managed charging aspects of the program will limit its negative impacts on the system.

In Wisconsin, Madison Gas and Electric filed its own application in March 2022 for three new managed charging pilot programs. The programs separately target apartments and workplaces, fleets, and single-family residential customers. Through the pilot programs for apartments and workplaces and fleets, the utility will own and install charging equipment at customer sites in exchange for a monthly fee, which ensures there is no cross-subsidization from non-participating customers. Participants will then receive an annual credit of $40 in exchange for the utility having remote access to control their charging. The single-family residential program builds off of the utility’s existing Charge@Home program, but targets customers who charge at home with a 240-volt cord instead of installing a charging station. Without a charging station, Madison Gas & Electric cannot manage the customer’s charging through the Charge@Home program, but the new program gives that control to the utility through telematics.  

The managed charging programs in existence today and those being actively considered by utilities and regulators use different incentive structures and design features to achieve the same result. Utilities and stakeholders alike want to shift customer charging behavior to limit the potential negative impacts of increased demand, and instead utilize excess capacity during off-peak times to benefit the system as a whole. With so much at stake and with an ever expanding interest in electric vehicles, we expect to see more and more managed charging proposals from utilities in the months and years to come.

* * *

To stay on top of managed charging programs and other EV-related policy activity, check out the 50 States of Electric Vehicles report series or the DSIRE Insight Electric Vehicle Single-Tech Subscription.

The Sale of Narragansett Electric to PPL: Comparing Clean Energy Targets

By: Rebekah de la Mora, Policy Analyst

On February 23, the Rhode Island Division of Public Utilities and Carriers officially approved National Grid's sale of the Narragansett Electric Company to PPL. This would put Narragansett's 780,000+ customers under the care of PPL, adding to their current 2.7 million customers. The attorneys general of both Rhode Island and Massachusetts then submitted motions to their respective supreme courts, asking for a halt to the sale. On March 3, the Supreme Judicial Court of Massachusetts halted the sale, on the grounds that the sale may need a full regulatory proceeding and approval in Massachusetts to review its impact on ratepayers. National Grid and the attorney general later reached a settlement agreement. Now, the case in the Rhode Island Superior Court is under way. The Rhode Island attorney general is arguing that the review of the sale did not take ratepayer impact or compliance with the new climate law into account.

The sale, however, is not the only thing put on hold. Many regulatory proceedings in Rhode Island related to Narragansett's programs have been on hold since the sale was proposed last year. Regulators want clarity on who will be running Narragansett before making decisions on any of the utility's programs. And, as mentioned above, many are concerned that PPL's practices will not fall in line with Rhode Island's new 2021 Act on Climate, which set emissions reduction goals to achieve economy-wide net-zero emissions by 2050.

Saying with 100% certainty whether PPL could meet the Act on Climate is impossible; the future is not so precise as that. A more reasonable question would be is PPL able to meet the Act -- as opposed to will PPL meet the Act. Looking at current expectations and previous actions, one can compare the ability of PPL to align with the state's climate law.

State Clean Energy Targets

First, what are the climate goals that have been set? Rhode Island's 2021 Act on Climate defined new emissions reduction goals, based on 1990 levels: a 10% reduction by 2020, 45% by 2030, 80% by 2040, and 100% by 2050. Pennsylvania has an executive order from 2019, based on 2005 levels: a 26% reduction by 2025, and 80% by 2050. Kentucky's 2011 Climate Action Plan, based on 1990 levels, recommended a 20% reduction by 2030. In addition, Rhode Island and Pennsylvania both have renewable portfolio standards in place. Pennsylvania's standard reached its final target in 2021 with an 18% requirement; Rhode Island's 2021 requirement was 17.5%, but the standard will reach its final target in 2035 at 38.5%. Comparatively, Rhode Island's goals are more stringent than the other two states, which means PPL's current climate actions would have to be revised to meet Narragansett's requirements.

Utility Clean Energy Targets

Along with government-mandated goals, National Grid and PPL have their own in-house emissions reduction targets. National Grid's, based on 1990 levels, are: a 20% reduction by 2020, 80% reduction by 2030, 90% by 2040, and 100% by 2050. PPL's, based on 2010 levels, are: a 70% reduction by 2035, 80% by 2040, and 100% by 2050. While the base years differ, PPL's percentages over time are more stringent than Rhode Island's state targets, and it still has a 100% net-zero target for 2050 like Rhode Island does. PPL's climate actions would, eventually, align with Rhode Island's goals, even if exact percentages reached over time weren't identical.

Emission Reductions to Date

Requirements and expectations, however, are not the same thing as action. So, second, how well are the utilities' achieving these goals? How much have they already reduced their emissions? National Grid reduced its emissions by 70% in 2020 based on 1990 levels, and PPL reduced its emissions by 59% in 2020 based on 2010 levels. While National Grid has demonstrated more progress and more ambitious targets, PPL's advancement is still well in line with both its internal 70% by 2035 target and Rhode Island's 45% by 2030 goal.

Other Issues

Overall, it cannot be said that PPL is wholly incapable of meeting Rhode Island's standards. Although the utility has less aggressive emission reduction targets, they are not low when compared to most utilities across the country. It is perhaps a lower score compared to National Grid, but it is not a low score in and of itself. That being said, meeting climate goals is not the only job of a utility. Other issues have been raised throughout the sale which could affect the performance of Narragansett -- for example, some concerns relate to storm response and resiliency.

As the smallest state in the US, Rhode Island has limited in-state resources when it comes to emergencies, e.g. power outages from snow storms or hurricanes. Under National Grid, Narragansett is able to take advantage of contiguous operations in Massachusetts and New York, sharing resources and labor in an emergency. It would not be able to do that to the same extent under PPL, which operates in Pennsylvania and Kentucky; additionally, weather-based emergencies in Pennsylvania and Kentucky are not the same as weather-based emergencies in Rhode Island, Massachusetts, and New York. 

PPL, on the other hand, argues that the distance would be a benefit. The distance between the service territories would mean that Rhode Island would not have emergency events at the same time as the rest of PPL's territory; generation plants in Pennsylvania and Kentucky would not be affected by the emergency, and resources could be fully allocated to Rhode Island without needing to split between the three states. The trade-off, then, would come down to how easily Rhode Island can take advantage of another state's resources: National Grid would require competition with other services territories but shorter wait times, while PPL would require longer wait times as labor and resources are moved across the Northeast but without competition.

How the pieces will fall is yet to be determined. A hearing was held on April 12 for oral arguments in the Rhode Island court case, and no other hearings are scheduled. The court is expected to make a decision with the current information, but when that will be is unknown.

* * *

To learn more about DSIRE Insight’s custom policy research and analysis services, contact us at afproudl@ncsu.edu.

Local Solar Policies and the SolSmart Program

By: David Sarkisian, Sr. Policy Project Manager

The DSIRE Insight team focuses a lot of our work on policies implemented at the state level, either by legislatures or by utility regulatory commissions. Energy policy is not just made by states, though. Obviously, some policies are developed and implemented at the federal level. On the other end of the scale, many important policies are developed by local governments. As media attention and policy discussions focus on federal and state-level policies, local government policies often fly under the radar. 

This does not mean that local policies are unimportant. Local governments control key policy areas, most notably the zoning and building permitting processes, that can have a large effect on the scale and type of renewable (and other) energy development in their jurisdictions. In the case of solar energy, local government policies can contribute (positively or negatively) to the oft-discussed “soft costs” that make up the majority of solar deployment costs. 

Some of the soft costs associated with local government policies reflect thorny policy concerns, such as preservation of historic neighborhoods and prevention of land-use conflicts. However, in many cases soft costs result more from a lack of clarity in zoning rules or unintended procedural hurdles than from deliberate policy decisions. These clarity and procedural issues often reflect the relative newness of distributed solar and the difficulty of regulating it within frameworks which were not designed with it in mind (similar issues are emerging with distributed energy storage and EV charging equipment, which are even more recent entrants into the popular market). 

Since 2016, the SolSmart program has helped local governments reduce these barriers and foster local solar markets. SolSmart is administered by the Interstate Renewable Energy Council (IREC) and the International City/County Management Association (ICMA), and funded by the U.S. Department of Energy Solar Energy Technologies Office. SolSmart is a recognition and technical assistance program that provides designation to local governments that have taken certain steps to reduce solar soft costs in their jurisdictions. Designation comes at three levels: Bronze, Silver, or Gold, with Gold being the highest level. The steps required to obtain SolSmart designation focus on the provision of clear and efficient definitions, rules, and processes rather than specific policy requirements, allowing communities to address other policy concerns while still providing a solar-friendly regulatory framework.  Since its inception, the SolSmart program has provided designation to nearly 450 communities in 41 states and D.C. A review of the SolSmart program indicates that designated communities have increased solar installations and faster permitting processes. 

To assist local governments in attaining designation, IREC and ICMA work with other organizations to provide technical assistance at no cost. DSIRE Insight team members have partnered with the SolSmart program several times to provide intensive technical assistance to communities in the U.S. Southeast. Any municipality, county, and regional organization in the United States is eligible to apply for SolSmart designation; please contact the SolSmart program for more information.

Data Gathering at Scale: Advanced Metering Infrastructure

By: Vincent Potter, Policy Analyst

Advanced Metering Infrastructure (AMI) is a key facet of grid modernization. AMI goes beyond meters, relays, switches, and other physical components of the grid. Each field device can potentially gather and transmit data about its status and the characteristics of the power that flows through it. Each field device is a potential data point that utilities and customers can leverage to make the best possible decisions. The data gathered can be sensitive; learning the exact load details of a factory can reveal some trade secrets. Likewise, residential load profiles can show occupancy, activity, and sleep schedules that many would not share publicly. 

Throughout 2021, 27 separate state or utility actions dealt with electricity data and data access. The 50 States of Grid Modernization 2021 Annual Report contains data about the progress and content of many of the bills and dockets regarding expansions in deployment of advanced infrastructure capable of collecting data and specific plans for utility utilization.

2021 Data Access Policy Actions

Data Acquisition

Advanced metering infrastructure is capable of measuring and transmitting large quantities of data back to a server. Electric meters can measure, in some cases minute-by-minute, changes in load demand and consumption patterns. Taken over long periods, this data makes a load profile that can be analyzed and used for any number of tasks by utility companies and end-users. Through careful analysis, utilities can make extrapolations for future usage trends or closely monitor grid outages in real time. Customers can use this data to find optimal times to run their industrial operations, determine benefits of on-site generation, or to decide on climate control schedules. 

Depending on the configuration of the system, advanced metering data can be presented in several ways. Real time information streams in from meters and field devices to servers for immediate or short-term analysis. Utilities can use this data to follow load curves and make tweaks to their dispatched generation. Historical data in 15-minute or 1-hour intervals can show usage trends over time. If real-time data affects day-to-day operations, then interval data is used for longer term planning. Historical interval data, for example, might be used to create a demand response plan to reduce peak load, but real-time data would be needed to deploy it most effectively. 

The glut of information from smart meters goes well beyond the historical utility purview of financial information and generation capacity and dispatch. Lawmakers and regulators are increasingly requiring utilities to safeguard customer energy data, and for good reason. By analyzing the load profile of buildings, a viewer can gain much information about what is going on inside. One can determine operational schedules, occupancy hours and trends, when large appliances are run, etc. While the utilities are entrusted with all of this information, they must take measures to aggregate and anonymize data when reporting to third parties. In some states, utilities can only provide customer energy data to third parties with customer consent. 

As of February 2022, eight states have bills pending in their legislatures that deal broadly with customer data access. These range from rules about whether utilities can sell their energy data to requiring utilities to articulate their plan for dealing with advanced metering infrastructure data. Most either require customer consent or explicit privacy rules before utilities can disclose non-aggregated data to third parties. Some regulators and lawmakers are also proposing rules that would provide customers with no-cost access to their data, requiring utilities to add to existing or create new web portals. 

Pending Data Access Legislation (February 2022)

Customer Data Uses

Customers of all rate classes can use their energy data to make more informed energy consumption decisions. Residential customers can sometimes have less control over their electrical demands than commercial and industrial customers but interval data can still prove useful, especially over time. If a residential customer has the same loads over time, but increasing energy usage, the data can tell them when their consumption is changing to help identify problems with equipment inside their home. 

Many large commercial and industrial operations have dedicated energy management strategies and employ devices that can monitor the energy needs of electrical panels or pieces of equipment. Electric data from advanced meters can supplement this pinpoint data to show the “big picture” of energy use at a facility. Commercial and industrial customers often have equipment driven by motors with large startup energy demands, but relatively lower continuous energy needs. Granular energy data can tell these customers what their energy use pattern is so that managers can determine the optimal schedule for equipment use to minimize electric demand (and demand charges).  

All customers who pay based on their peak electric demand can benefit from real-time or interval electricity data. Bills and utility records from the analog era can only tell a customer what their peak consumption was and not when it occurred. Smart meter data can show the customer how their energy use changes over time so that they can match their energy peak with their system operations and decide if their peak energy use can be reasonably reduced. Peak reduction strategies include changing operation schedules, retrofitting equipment and facilities, or offsetting peaks directly with on-site generation or energy storage. Deployment of energy storage or generation to reduce peaks depends on accurate real-time energy data for the best results. 

Customers can also leverage the data from advanced metering to compare utility rate options. Many electric tariffs do not charge different prices for consumption at different hours of the day, meaning that customers have little economic incentive to change their consumption behaviors. With time-varying rates, sometimes called “Time of Use” or “Time of Day” pricing, utilities charge different prices throughout the day to partially reflect the expense of generating excess energy during periods of high demand. Using granular energy data, customers can compare their energy use with their utility’s rate offerings to either determine the best tariff to match their consumption pattern, or to tell what activities they may need to alter to best deal with a new electric rate.

Utility Data Uses

Utilities have employed demand response programs in varying forms for decades. These programs allow the utilities to isolate and de-energize certain equipment in times of high energy demand. Typical targets for demand response programs include air conditioners and large equipment on intermittent schedules. 

An outage management system (OMS) collects reports of power outages and can predict failed equipment and fault location related to system reports of outages. Customer-facing data for system outages come from these systems, they also record outages and less serious system faults for regulatory reporting. OMS manage unexpected fault data including detection, location, repair and isolation. An OMS is a coordinator for tasks, planning outages, recordkeeping, and processes associated with distribution system outages. OMS can be a communication system for utility stakeholders, internal and external, and provide the backbone of outage notifications for app or web interfaces.  

Advanced OMS can use precise location data to display faults and system issues in real time. OMS can reduce the need for searching for faulty parts of a distribution system and thereby lessen the time for personnel to start repairs to restore operations. Combined with remotely operated switches, faulty sections of the network can be isolated or bypassed to maintain service to as many customers as possible. The utility can use the OMS to make predictions for system behavior during faults and use that data to inform their planning efforts. 

Utilities have to factor in a lot of information to plan for system upgrades and additions. Using granular data as part of energy modeling, utilities can form a more complete picture of their customer demands and plan accordingly. Generation and transmission capacity can be compared to usage trends and data from their customers, which can provide more relevant information than generalizations or industry standard data. In the context of transmission build-out, the utilities can use real data from their service area to see where their feeders and infrastructure may soon be insufficient and allocate funds accordingly. 

Overall

Both utilities and customers make decisions with the best data available at that moment. Advanced metering infrastructure can provide utilities with more precise and more reliable data for planning and system operations. Customers can take advantage of this data as well to make the best decisions on how and when to consume electricity, choose the best rate option to fit their needs, and identify potential equipment problems that may not be immediately obvious. Because energy data can reveal so much about operations, schedules, and even personal habits, there are many regulations on how this data is stored and presented. Lawmakers and regulators are directing utilities to become custodians of customer data; many utilities are required to protect customers’ data and make it available to customers and their designees through secure means. 

* * *

Keep up with legislative and regulatory changes related to data access with the 50 States of Grid Modernization report or DSIRE Insight’s Single-Tech Grid Modernization Subscription.

The Quick and Dirty on Agrivoltaics

By: Ethan Beaulieu, Energy Policy Research Assistant

Agrivoltaics can be broadly understood as the co-opting of agricultural land and practices, with solar photovoltaics (PV). Agrivoltaics can appear in a variety of structural types, each intended to create conditions in which dual use of land with solar PV arrays is viable. Agrivoltaics demonstrates that the relationship between agriculture and solar PV around land use, need not be exclusively competitive. In many cases, agrivoltaics is mutually beneficial for both those wishing to protect or restore traditionally agricultural land, and those satisfying the demand for solar PV systems.

What Solar Agrivoltaics Look Like

Solar agrivoltaics is not exclusive to large-scale utility solar PV systems. Due to the flexibility in which arrays can be installed, solar agrivoltaics is attainable for both commercial use and large-scale utility projects.

The structure type that is first brought to mind for many people is raised structures. This technique includes the installation of solar PV arrays on stilts a number of feet above the ground. Crops are then cultivated underneath the panels. The solar PV arrays have the potential to have sun tracking systems for increased efficiency, though for temporary systems, the investment may not be worth it. This structure type appears to be the most popular and occupies the majority of research on agrivoltaics. However, the raised structures are not without drawbacks. Increased initial investment is required compared to traditional solar PV arrays, due to additional material and labor. The structures are by nature larger than traditional solar PV due to their elevation which, in turn, needs to be reinforced against wind.

The second structure type, spaced, is similar to traditional ground-mounted PV systems. In this arrangement, solar arrays are mounted low to the ground and set in alternating rows with crops. These systems have significantly decreased density of solar arrays compared to other systems. However, they allow for the possibility of mechanized agriculture where the machines are able to hurdle the arrays. Such systems also are a lower initial investment compared to raised structures.

How Agrivoltaics Affect Soil Quality and Conditions

It should first be noted that there is a great deal of variety in soil types, topography, and climate conditions throughout the United States. Therefore, some issues or benefits may be more or less exaggerated depending on the environmental factors.

The first issue that arises with agricultural land that intends to be used for normal operation in the future is soil compaction during construction and decommissioning. During both of these phases, heavy machinery and equipment will be needed to install or remove arrays on the land. The weight of the machines has the possibility of compacting soil, which can reduce the productivity of the field. To minimize compaction and maintain soil quality, the following practices are followed:

  • Reducing the number of roads on the site and placing them on less productive land

  • Avoiding the use of gravel

  • Not removing the layer of topsoil during construction

  • Leaving as much vegetation as possible during installation to avoid erosion

  • Using pallets, wooden planks, or other means to distribute weight of machinery on roads

  • Drilling in or ramming steel posts rather than using large machinery during installation

It should be mentioned that while it is possible to mitigate soil compaction, certain activities have a greater likelihood of compaction. For raised systems, the installation of the structure requires that steel beams be placed at a substantial depth within the ground. The taller the structure, the farther down it must go. The associated labor and weight of material contributes to the level of compaction. In cases of severe soil compaction, tools like tractor mounted chisels, or vibrators that can break up affected soil.

Compared to raised structures, spaced ones see a lesser degree of compaction. One of the benefits of having a spaced agrivoltaic layout is that in high wind conditions, the solar arrays act as a buffer to deter erosion.

What Types of Plants Are Best Suited to Agrivoltaics?

The biggest determining factor in crop choice is shade tolerance. Sufficient light must be passing through to the ground for the crop to flourish. In the case of raised structures, this is affected by the height of the structure. Crops that require large amounts of light and suffer significantly from its reduction are not good for agrivoltaics. This would include barley, corn, wheat, and fruits. However, many leaf vegetables and berries benefit from less solar radiation. These include spinach, hops, onions, cucumber, zucchini, and a variety of other crops. As a general rule, crops that are grown in rows and do not require mechanized agriculture have been seen to perform the best economically, since the panel height is less likely to interfere with farming activities.

A number of studies found that compared to control groups, agrivoltaic systems helped the soil retain moisture, improved the production of some crops, and reduced ground temperature during the day and made it warmer at night. For many, there may be a concern that heat from the solar panels will negatively affect the crops beneath or around them. Traditional solar PV arrays with gravel ground cover may have a heat feedback loop or “heat island” effect, which exists near the array. However, the heat feedback loop created by the gravel and panel’s greater ability to absorb temperature than normal land, can be countered by using ground cover vegetation and strategic planting. Studies found that the temperature of solar panels in agrivoltaic systems were lower than that of traditional PV systems using gravel ground cover. Lower panel temperature also allows the panels to perform better.

The Bigger Picture

There are still many roadblocks to the widespread use of agrivoltaic systems, namely issues with zoning and land use. Since authority over land use is delegated to state governments and then to municipalities, there is a great deal of inconsistency in zoning law regarding agrivoltaics. While such systems still perform their agricultural function, they are subject to the same permitting and regulatory process that a conventional solar PV installation would be. Only the state of Massachusetts has a policy program intended to promote and incentivize agrivoltaic development.

Agrivoltaics may not be the ideal solution for all utility-scale PV systems, but for farmers looking to capitalize on unused crop land, those who would like to revitalize topsoil while still obtaining revenue, or would simply like to preserve traditionally agricultural land, agrivoltaics presents a valuable opportunity. More broadly, it represents the combination of what are often conflicting interests, and how co-operation can be mutually beneficial.

Legislative Activity on Community Solar in the Midwest

By: David Sarkisian, Senior Project Manager

Community solar is a program model allowing people, businesses, and organizations to purchase shares or subscriptions to the output of larger-scale solar projects. It provides an avenue for access to solar energy for people who cannot, or prefer not to, install rooftop solar panels. Community solar programs can be offered by electric utilities, and in many states community solar programs allow participation by third-party providers. 

In the Midwest, community solar has historically had a foothold in Minnesota, which currently has the largest amount of third-party community solar capacity of any state. More recently, Illinois has seen considerable community solar activity in connection with its 2016 Future Energy Jobs Act, which established two REC-based incentive programs for community solar (and other solar) development. Illinois’ 2021 clean energy legislation, the Climate and Equitable Jobs Act, continues and expands the state’s support for community solar.

Throughout 2021, several other states in the Midwest and Great Lakes region have shown interest in third-party community solar legislation. These states include Michigan, Missouri, Ohio, Pennsylvania, and Wisconsin. Currently, legislators in all five of these states have introduced (or pre-filed) legislation that would establish third party-led community solar programs. All of these bills are still in the very early stages of the legislative process, but it will be interesting to see how they develop through the end of 2021 and into 2022. The different bills are discussed below.

State Community Solar Policies (December 2021)

Michigan

Michigan legislators have introduced two different bills that would establish a third-party community solar program. One of these bills, H.B. 4715, leaves most of the specifics of program design to the state Public Service Commission, while the other bill, H.B. 4716, creates more specific requirements for the program, setting a maximum system size of 5 MW and establishing credit rates using Michigan’s inflow-outflow DG compensation methodology. These bills were introduced in April 2021, so their prospects for action in 2021 are not clear, but the Michigan legislature meets year-round, so it is possible that they will yet be acted on this year.

Missouri

In early December 2021, Missouri legislators pre-filed two community solar bills for the 2022 session. Both Missouri bills cap community solar capacity at relatively limited levels; one bill, H.B. 1536, allows for a total of 6 MW of community solar garden capacity per electric utility until 2026, while the other bill, S.B. 824, limits total solar electricity provision under the program to 2% of the relevant utility providers’ electricity sales. The bills also have different individual system size limits, with H.B. 1536 initially requiring systems to be no more than 500 kW, while S.B. 824 would allow for systems up to 5 MW.

Ohio

Lawmakers in Ohio introduced two separate community solar bills in fall 2021. Interestingly, both Ohio bills would allow for retail rate crediting of community solar subscribers. H.B. 429 would allow for virtual net metering and envisions it to be used to facilitate community solar programs. H.B. 450 also requires community solar subscribers to be credited using net metering. H.B. 429 does not specifically limit aggregate or system capacity, while H.B. 450 has a total limit of 2 GW (plus an additional 1 GW specifically for distressed sites), and a system size limit of 10 MW (45 MW for distressed sites). H.B. 450 also requires that a majority of total capacity be deployed in the Appalachian region.

Pennsylvania

Pennsylvania currently has two community solar bills under consideration: H.B. 1396 and H.B. 1555. The two bills differ on their crediting method; H.B. 1396 calls for crediting based on net metering, while H.B. 1555 would use a value stack method based on prices from the PJM markets. The bills also have slightly different individual system size limits (3 MW for H.B. 1396 and 5 MW for H.B. 1555). Both bills require that no one subscriber be allowed to subscribe to more than 50% of a facility’s capacity, except in the case of master-metered multifamily buildings. Both bills also include provisions aiming to make the programs accessible to lower-income customers; H.B. 1396 calls for a minimum participation target for low and moderate-income customers, while H.B. 1555 would require that subscription costs not exceed the value of bill credits and disallow upfront costs for low-income customers.

Wisconsin
Wisconsin legislators introduced companion bills on community solar in August and September 2021. A.B. 527 and S.B. 490 would create a third-party community solar program. The program would have an individual system size cap of 5 MW, but, interestingly, the bills do not appear to require an aggregate capacity limitation; this would make the program similar to the one in neighboring Minnesota. The Wisconsin bills also do not explicitly set a credit rate for community solar projects, instead requiring that the state Public Service Commission set the credit rate at a level that results in “robust” community solar development. A proposed amendment to the bills would change this provision to instead require the credit rate be based on the full economic value provided by the solar facilities.

Coal Dependency in West Virginia: A Brief History and Future Outlook

By: Ethan Beaulieu, Energy Policy Intern

As the dust in Washington settles around the infrastructure bill, attention has turned to the proposed budget reconciliation bill (“Build Back Better” plan), which includes a variety of investments and incentives related to clean energy. Senator Joe Manchin of West Virginia has been a major critic of the Biden administration’s Build Back Better plan for a number of reasons, including his state’s heavy reliance on coal for both energy generation and economic productivity. The razor thin Democratic majority in the Senate has made Senator Manchin an essential vote for the reconciliation bill’s passage, amplifying his influence over its contents.

Senator Manchin’s trepidation about proposed items like the Clean Energy Performance Program, which would have rewarded power companies for increasing the portion of renewables by a set amount each year and penalizing those who don’t, is not without basis. West Virginia has long been considered coal country, producing the second greatest amount of coal in the U.S. after Wyoming, and coal-fired power plants accounting for almost all of West Virginia’s electricity generation. With such heavy reliance on coal as both a consumed and exported product, and a local history and culture surrounding its production, Manchin is caught between the party priority and constituency obligation. Nationwide, coal has been in significant decline since its U.S. consumption peak in 2007, but still accounts for the vast majority of electricity generation in West Virginia. In the following, we will work to understand exactly how reliant West Virginia is on coal, as well as look at sources of the decline and steps taken towards energy diversification.

A Brief History of Coal in West Virginia

Coal has long been a known resource in West Virginia. The first mine reportedly opened in 1810, but was used largely for local consumption into the early to mid-nineteenth century. As railroads spread throughout West Virginia, the commercial coal industry began to grow, and in 1883 major rail lines were completed bringing the production that year to total almost 3 million tons. Coal became a dominant economic force in West Virginia, peaking in 1997 with 181,914,000 tons produced. The Appalachian Plateau region holds much of the state’s coal, though crude oil and natural gas wells also exist in the area. As of now, West Virginia is the nation’s fifth largest energy producer, providing a net total of 5% of the nation’s energy, the majority of which comes from coal-fired power plants.

Proportion of State Electricity Generated by Coal

The State of Coal

In 2019, West Virginia was responsible for over one eighth of the nation’s coal production. The state continues to be the largest producer of bituminous coal, the most common type in the U.S.. West Virginia consumes only a quarter of the coal produced with the remaining three-quarters being shipped largely to a collection of 20 states, as well as foreign markets. Unlike domestic trends, international demand has been extremely volatile in recent years. Coal exports from West Virginia fell from $7.9 billion in 2012 to $1.4 billion in 2016, only to reach $4.5 billion in 2018 before falling again to $2.2 billion in 2019. While the overall trend has been downward, the rate of the drop is inconsistent. In terms of consumption, West Virginia generates electricity almost entirely from coal-powered plants, with eight of the state’s ten largest power plants being coal-fired. As of 2020, 89% of electricity in the state is generated by coal compared to 19% nationwide.

The Decline of Coal

To those both in West Virginia and outside the state, the decline of coal has been apparent in recent years. Last year, Longview Power LLC filed for Chapter 11 bankruptcy protection because of lessened demand for electricity due to growing competition from natural gas, an unusually warm winter, and pandemic impact. Employment by the coal industry fell by 54% between 2005 and 2020, with the counties having the greatest dependence on the industry facing the most severe losses. Tightening pollution regulations have forced American Electric Power’s (AEP) West Virginia coal-fueled power plants to undergo $448 million in upgrades to remain federally compliant through 2040 rather being shut down in 2028. The upgrades are projected to increase electricity rates by 3.3% in September of 2022. This is on top of AEP’s cumulative rate increase of 122% over the past 13 years. Despite the increase in price to consumer and producer alike, coal consumption has dropped marginally compared to the national average. West Virginia’s coal use in energy production dropped only from 98% in 2001 to 89% in 2020, versus the 52% to 19% nationwide.

Coal production in West Virginia has dropped more considerably, with a 65% decline between 2005 and 2020. The decrease stems from a combination of national and local factors including new regulations which have increased the cost of coal production and usage, a reduction in coal mining productivity from decades of aggressive mining in Central Appalachia making the remaining coal more expensive to extract compared to other coal basins, and increased competition from natural gas as a source of fuel for the power industry.

What Comes After Coal?

Given the broad decline in coal use, heavy reliance on coal as a source of revenue, employment, and energy generation faces threats to long term viability. So, what has West Virginia done to address this issue? In 2009, West Virginia enacted a Renewable Portfolio Standard (RPS) requiring investor-owned utilities and retail suppliers with over 30,000 customers to produce 25% of their electricity from alternative and renewable energy resources by 2025. It should be noted that West Virginia allowed non-renewable resources like coal technology, coalbed methane, and natural gas to meet the RPS goals. Despite this lax requirement, West Virginia repealed its RPS in 2015.

Aside from the now-repealed RPS, West Virginia has made some progress in terms of utilizing other energy resources. Senate Bill 583 created the state’s first utility solar program, allowing American Electric Power and First Energy to install 200 MW of solar capacity in 50 MW increments. In 2021, state lawmakers enacted legislation authorizing the use of third-party power purchase agreements for on-site solar generation. In 2019, coal accounted for the smallest portion of the state’s electricity generation at close to 89%. Natural gas reached a record amount of 3% of net generation, while hydropower and wind each accounted for approximately 3%. Hydroelectric generation has nearly doubled in West Virginia in the past 20 years with the operation of a new 44 MW plant in 2016.

While West Virginia has made some progress towards energy diversification in the last decade, growing regulations on carbon emissions and broader energy market trends threaten the bedrock of the state’s electric generation. If current trends continue, West Virginia is likely to face increased unemployment affecting rural areas the most, continuously rising electric utility rates, and potential energy insecurity. A silver lining to West Virginia’s predicament is that energy sources have started to see a more even playing field. This opportunity opens the door for renewable energy to provide jobs to areas that had once been provided by the coal industry. Companies like Nitro Construction services, which was originally oriented towards the coal industry, have begun working in the solar business. As coal takes up less of the market, the opportunity for West Virginia to become a leader in clean energy emerges.

What Happened to PACE Financing?

By: Ethan Beaulieu, Energy Policy Intern

The model for property retrofitting loans known as Property Assessed Clean Energy or PACE, originated in California in 2008. The program quickly gained popularity and was introduced throughout the state. Currently, PACE has a legislative basis in 37 states, with 26 states having active programs. R-PACE or Residential PACE is only offered in California, Florida, and Missouri. Over the past decade PACE, and in particular R-PACE, has become subject to significant public criticism, suffered a decline in participation, and even termination of the program in some municipalities. The R-PACE program, once lauded by President Obama and at the time Vice President Biden as a boon to energy efficiency home improvements for low-income homeowners, has become tainted by a lack of consumer protections, reports of aggressive contractors, and deceptive loan practices. Still, PACE programs continue around the country and Commercial PACE (C-PACE) programs continue to expand to new municipalities. The twin programs R-PACE and C-PACE are still argued by some as being a way encourage shifts to clean energy while minimizing government subsidies and utilizing market mechanisms. The latter half making the switch to renewables significantly more palatable to some.

Status of PACE Financing by State (2021)

So What Exactly is PACE?

PACE programs exist in two forms: C-PACE or Commercial PACE for businesses, and R-PACE or Residential PACE for homeowners. While these two programs differ significantly, they share a core structure and intention. PACE programs allow property owners to finance the upfront cost of energy and other eligible efficiency related improvements through a fixed interest rate lien that is paid off over time in the form of an added tax assessment. These typically range between 5 to 25 years in length. One of the unique characteristics of this financing tool is that the assessment (loan payments) is attached to the property. Thus, if a property were sold, the assessments will fall to the next property owner. These programs typically are only used for existing structures. It is also important to note that state law provides that these liens have a superior priority status over mortgages. Since the lien payments are tax assessments, failure to pay these could result in tax foreclosure of the property. In such cases, the PACE loan providers have first dibs to funds generated from the foreclosure, ahead of previous mortgage lenders.

From a policy perspective, PACE programs are state legislated initiatives that authorize counties or municipalities to create a financing mechanism for home energy improvements, utilizing private parties to administer it. The program lends to homeowners for eligible products and services through approved contractors at fixed interest rates. In order to attract private lenders, their loans are imposed as a tax assessment on the property, giving the lenders superiority over mortgages and thus being an incredibly safe investment for them. It is important to highlight that PACE loans are not a second mortgage or equity lending, and the maximum loan amount is determined as a portion of the assessed property value (generally around 15-20%).

The Benefits

As mentioned before, PACE loans offer a way for businesses and homeowners to get energy efficiency or eligible improvements with no upfront cost. In theory, the cost of improvements are offset by the savings generated from the efficiency improvements. This is in part why the loan terms are so long. Another benefit is that since the lien runs with the land, the cost can be passed from one owner to the next. This addresses the very valid concern of investing in energy improvements, but not staying with the property long enough to pay off the initial costs.

For investors and lenders, both Commercial and Residential PACE bonds and loans prove to be a very high security investment due to their special priority status of mortgages.

Residential PACE Loan Hazards

Since their inception, PACE loans have been plagued with controversy. A well-intentioned program even championed by former President Obama and sitting President Biden, still exposes borrowers to extensive risk and undermines aspects of the housing finance system.

R-PACE loans in particular have proven to be dangerous due to their marketing to low-income households as a safe way to retrofit your home with money saving, environmentally-friendly improvements. However, R-PACE has few consumer protections at the federal level and inconsistent protection among states. Commercial PACE programs have even fewer protections at the federal level as they were explicitly excluded in 2019 Consumer Finance Protection Bureau (CFPB) regulatory changes. These and other related regulations will be discussed later.

Often, R-PACE loans are marketed through door-to-door sales and telemarketers, which fundamentally pose a risk for deceptive sales tactics due to the expeditious nature of the interaction. This, in combination with applications being approved and signed electronically and/or through a phone call, makes abuses that much easier. Additionally, because your eligibility for PACE loans is determined as a portion of your assessed property value, your ability to pay off the loan can in many cases not be considered. On top of this, state laws provide for localities to collect up to 10% of the loan amount in administration fees. The combination or rolling administration fees, frequently above market interest rates, lack of consumer recourse in case of workmanship issues since contractors are partnered with PACE providers, inadequate disclosures, indiscriminate lending, and generally lagging regulations can end up with homeowners unwittingly signing up for improvements that never pay themselves off and in worst-case scenarios, lead to foreclosure. R-PACE especially fails to protect owners from unscrupulous lenders and aggressive contractors in the ways that normal lending and finance protections would.

Risk and Unfair Advantages of the Superior Lien

As mentioned before, PACE loans are paid off in the form of an attached property tax assessment that runs with the land and has the unique characteristic of being super-priority over all other lien holders. Meaning, if the property owner fails to pay the assessment and it goes to foreclosure, they get to cut to the front of the debt collection line and collect their proceeds. This means that PACE loans are very secure investments, but only at the expense of existing lien holders who did not consent to the new lien and now face an increased risk of loss. In a 2010 response to this, the Federal Housing Finance Agency (FHFA) directed mortgage underwriters Fannie Mae and Freddie Mac to stop purchasing and refinancing mortgages on properties with PACE priority liens. This had a massively depressive effect on R-PACE loans, which now only exist California, Florida, and Missouri. The Fannie Mae and Freddie Mac advisory does not include C-PACE loans. The unfortunate side effect is that those who have existing PACE liens may have a difficult time selling their property.

Regulatory Responses

In a 2018 response, Congress enacted amendments to the “Truth in Lending Act” (TILA), which effectively applied the federal standards of loan regulation to PACE, since they had not been before. The CFPB was tasked with the implementation of this law. In 2019, the CFPB published an Advanced Notice of Proposed Rulemaking on R-PACE that among other things, specified that loan providers must ensure TILA’s ability-to-repay (ATR) requirements applied to R-PACE and established procedures for violations of such requirements. It should be noted that this applies only to Residential PACE and not to Commercial PACE. In terms of state regulation of PACE programs, regulation is largely dependent upon the given state and municipality. Some states that offer R-PACE have made significant efforts to protect consumers in recent years, most notably California. Still PACE programs are far less regulated as a whole compared to similar lending options.

The Verdict

Are PACE loans right for you? If you’re a low-income household looking to make energy efficiency improvements, the answer is probably no. PACE interest rates currently aren’t competitive and provide greater risk to the consumer. Even if they were safer, low-income households are also likely eligible for free energy efficiency improvements through programs like the federal Weatherization Assistance Program or other lower cost options. It is important to make sure that you are aware of all available programs before making a decision, particularly if the PACE program being pushed to you is through a door-to-door salesperson.

If you are a business or high-income individual looking to retrofit your home, C-PACE or R-PACE may still be a good option for you. The benefit of being able to pass on the lien is a huge benefit for businesses who want to reduce their environmental impact, but don’t want to risk a massive investment in a potentially temporary property. Similarly, high-income individuals could use this to increase property value. It is always recommended to get an energy/water audit before the homeowner selects their improvement, but it is not required. Some may even knowingly accept that the improvements may not pay for themselves, but still provide the benefit of reducing their impact on the environment.

While PACE has significant pitfalls, it is a well-intentioned plan that perhaps with more finetuning could see a return to popularity. When considering a PACE lien, always make sure to take your time and deliberate whether the benefit of retrofitting and value of reduced environmental impact account for the risk.

Climate Events Spur Grid Investment Across the U.S.

By: Meghann Papsdorf, Policy Analyst

Released in August 2021, the Intergovernmental Panel on Climate Change (IPCC) Sixth Assessment Report sent a “code red” to the world by highlighting the increasing intensity and frequency of future climate events. The message was hardly surprising as the U.S. experienced record-breaking storms, wildfires, and flooding across the country in just the past few years, all of which had profound impacts on the electricity system. With more climate events expected on the horizon, ‘resiliency’ has become a buzzword in the electricity sector.

This year is a prime example of how the resiliency of the electricity system will continue to be tested. In February, a winter storm left 70% of Texas residents in the dark. The category 4 Hurricane Ida hit in August, resulting in a widespread blackout for 1 million Louisiana residents and historic flooding in New York. After another devastating wildfire season last year, utilities in the West are currently announcing planned outages for millions of residents as part of a key strategy in the region’s wildfire mitigation plans. With the likelihood of increased climate events, utilities are projected to invest about $1 trillion in the power grid from 2020 to 2030. Indeed, in the past few years, record-breaking climate events like these have motivated states to increase the resiliency of their systems, as seen below.

Climate Risks and Resilience-Motivated Grid Modernization Investments

Note: Climate risk data represents the top disaster for each state, according to the National Oceanic and Atmospheric Administration. Grid modernization investments include those currently under consideration or approved within the past three years.

How are state regulators responding to these increased threats?

Deployment

Many states are increasing investment in distributed energy resources (DERs), including combined heat and power systems, renewable sources, and storage, because of the reliability these resources provide grid operators. DERs help to diversify a state’s generation mix to reduce the grid’s dependency on a single fuel type, as well as provide key supply when larger generators go offline in the event of a severe storm. DERs can alleviate system congestion and avoid or delay the construction of costly infrastructure. Moreover, states are increasingly turning to energy storage as a key technology to counteract the risks of climate events, as storage can help offset risks to fuel supply and provide grid services. Because any risk to the system can threaten the reliability of electricity reaching end-users, some storage investments are directed to increasing behind-the-meter solar and storage deployment.

Integration & Monitoring

Alongside further deployment of DERs, states are also investing millions in advanced metering infrastructure, advanced distribution management systems, distributed energy resource management systems, and demand side management. These systems help utilities optimize the integration of DERs, detect and trace outages and voltage issues, and aid in reconfiguration during widespread outages. The most common grid modernization investment is smart meter installation. Smart meters can enable time-based pricing, improve control over consumption, and allow for high usage alerts, all of which can help prevent outages during high-demand events, such as heatwaves or ice storms. 

There has also been an uptick in microgrid investments to further integrate DERs. Because microgrids are anchored by on-site generation, they can operate in “island mode” when the larger system is hit by extreme weather. From hurricanes to wildfires, climate events have spurred most of the microgrid legislation across states in the past few years. Many microgrid policies start with pilots to support critical facilities, like hospitals, fire departments, and police headquarters, and have moved into supporting residential and commercial/industrial customers.

Hardening

Grid hardening is also a common investment aimed to address the susceptibility of transmission and distribution infrastructure, such as lines, poles, towers, transformers, and switchgear, to climate events. Hardening includes tree-trimming, pole inspection and upgrades, and smart grid technology installation, helping to prevent the destruction of key infrastructure and ultimately to minimize the impact of an outage.

Laying the Groundwork

Some state regulators and utilities are incorporating further consideration of climate events in distribution planning or initiating studies to model future climate impacts and to address the concerns of vulnerable communities.

* * *

To stay up to date on utility grid modernization investments and resiliency efforts, consider subscribing to the 50 States of Grid Modernization quarterly report series or DSIRE Insight’s Grid Modernization Single-Tech Subscription.

Financial Incentives Fueling the Expansion of Electric Vehicle Markets

By: Brian Lips, Senior Policy Project Manager

State governments and electric utilities across the country are offering financial incentives for the purchase of electric vehicles and associated charging equipment. DSIRE Insight staff have identified more than 250 incentive programs, varying from broad grant programs implemented by state transportation authorities or other state agencies to highly specific rebate programs provided by electric utilities. Recently, staff added these incentive programs to the Database of State Incentives for Renewables and Efficiency (DSIRE).

Utilities are more likely to provide incentives for electric vehicle supply equipment (EVSE) than electric vehicles themselves, while state governments are more inclined to incentivize electric vehicles than EVSE. States also favor grant programs, with nearly half of the incentive programs offered by a state government coming in the form of a grant program, often funded through the Volkswagen Environmental Mitigation Trust.

Financial Incentives for Passenger Electric Vehicles

Blog-EV-Map-Aug2021.PNG

Incentives are available for a broad array of electric vehicles types, including all-electric passenger vehicles, plug-in hybrid electric vehicles, electric buses, and medium- and heavy-duty electric vehicles. Incentives for passenger electric vehicles are currently available in 31 states, while incentives for electric buses are available in 22 states.

Financial Incentives for Electric Buses

Blog-EBuses-Aug2021.PNG

Financial incentives for electric vehicle supply equipment are available 43 states, with many of these programs offered directly by utilities and focused on specific market segments, such as residential, multi-family, commercial, workplace, and highway. Many of these programs require charging stations to be “smart” or “networked” and that rebate recipients participate in special rates for vehicle charging that typically vary by time of day.

Financial Incentives for Electric Vehicle Supply Equipment

Blog-EVSE-Aug2021.PNG

While some of the state grant programs funded through the Volkswagen Environmental Mitigation Trust are temporary in nature and winding down, states lawmakers and electric utilities continue proposing new incentive programs. During the second quarter of 2021, DSIRE Insight staff recorded 133 actions ongoing or under consideration in 32 states related to incentives for electric vehicles or charging infrastructure. Twelve states enacted bills creating or modifying incentives for electric vehicles or charging infrastructure during the quarter, and electric utilities proposed new incentives or incentive modifications in six states.

* * *  

Visit the Database of State Incentives for Renewables and Efficiency (DSIRE) to view incentive programs for electric vehicles and charging infrastructure. To stay up to date with changes to electric vehicle policies and incentives, check out DSIRE Insight’s 50 States of Electric Vehicles report and Single-Tech Electric Vehicle Subscription.

Clean Energy Standards Gaining Attention Across the U.S.

By: David Sarkisian, Senior Policy Project Manager

Clean energy standards are policies aimed at increasing the percentage of electricity generated by resources that do not emit carbon dioxide. These standards have substantial overlap with renewable portfolio standards; the difference between the two policy types is that clean energy standards can include some non-renewable, but carbon-free resources, like nuclear energy. The term “clean energy standard” can also refer more generally to the newer generation of renewable and clean energy policies that have aimed to largely (or entirely) eliminate carbon emissions from the power sector, in contrast to earlier renewable portfolio standard policies that had much lower percentage requirements and were aimed specifically at supporting the development of renewable energy technologies. State clean energy policies are also often accompanied by policies aiming to reduce carbon emissions outside of the electricity sector, and may be part of economy-wide greenhouse gas reduction policies.

As we have reached the halfway point of 2021, and most state legislative sessions have ended or are winding down, it is a good time to take stock of what actions states have recently taken on clean energy standards. 

Renewable and Clean Energy Standards (July 2021)

Below are states that have taken action on clean energy or renewable portfolio standards since we last reviewed these policies in September 2020:

Arizona 

In June 2021, Arizona’s Commerce Commission voted to adopt a goal for net-zero carbon emissions from electric utilities by 2070. This decision came after the Commission rejected a proposal for a similar rule package requiring net-zero emissions by 2050 in May 2021.

The Arizona Commerce Commission has been considering changes to the state’s renewable energy standard and accompanying rule changes since 2018. As the new rules have not yet been formally adopted, they are not yet included on the map above; final adoption is expected to take place in fall 2021.

Massachusetts 

In March 2021, Massachusetts Governor Charlie Baker signed Senate Bill 9, adopting a target for net-zero statewide greenhouse gas emissions by 2050. This target had already been adopted on a regulatory basis in 2020 by the state’s Secretary of Energy and Environmental Affairs, but the 2021 legislation formalizes the goal in state law.

The net-zero goal has interim requirements of a 50% reduction by 2030 and a 75% reduction by 2040. Unlike the Arizona policy discussed above, the Massachusetts policy incorporates all sectors of the economy, not just the electric power sector. As Massachusetts has not yet adopted sector-specific requirements based on this new legislation, the targets listed on the map above do not incorporate the requirements of the new legislation.

Michigan

In September 2020, Michigan Governor Gretchen Whitmer issued Executive Directive 2020-10, adopting a state goal to achieve economy-wide carbon neutrality by 2050. This order calls for the State’s Department of Environment, Great Lakes, and Energy to develop an action plan for reducing greenhouse gas emissions and achieving carbon neutrality; the action plan is due to be submitted by the end of 2021, with a draft plan due by September 1, 2021.

Oregon

In July 2021, Oregon Governor Kate Brown signed House Bill 2021, adopting a unique policy quite similar to a clean energy standard. Unlike other policies of this type, which typically specify requirements in terms of percentage of electricity generated, Oregon’s bill specifies greenhouse gas emission reduction targets for its two major investor-owned utilities. The targets require an 80% reduction in greenhouse gas emissions from 2010-2012 levels by 2030, a 90% reduction by 2035, and a 100% reduction by 2040.

Federal Action

In addition to the actions occurring in states, discussions of a possible federal clean energy standard have picked up as part of Congressional infrastructure proposals, with Democrats aiming to include a clean electricity standard as part of their budget reconciliation package. Although specific details on this clean electricity standard are not yet available, Minnesota Senator Tina Smith, one of the lawmakers working to write the legislation, indicated that it would aim for the electricity sector to get 80% of its energy from “clean” sources by 2030. Smith also indicated that the standard would include nuclear energy and fossil fuel energy with carbon capture technology.

2021 Legislative Round-Up: A Productive Six Months for Solar, Storage, and Electric Vehicle Legislation

By: DSIRE Insight Team

With 32 state legislatures having adjourned their 2021 sessions, the dust is starting to settle on a very active year for state lawmakers. The 18 remaining states are still actively engaged in considering energy legislation, and governors in 12 of the 32 adjourned states still have time to sign or veto pending legislation, so DSIRE Insight staff will remain busy for the foreseeable future. A total of approximately 859 bills related to distributed solar, grid modernization, and electric vehicles were introduced during 2021 with 103 becoming law in 33 states.

Solar, Grid Modernization, & Electric Vehicle Bills Enacted in 2021

June-2021-Blog-Map.PNG

Distributed Solar

As of mid-June 2021, state lawmakers have introduced 155 bills related to net metering, community solar, and third-party ownership, 19 of which have been enacted. An additional 6 bills have passed at least one chamber. While some of the approved bills made relatively small amendments to state law, other bills made significant changes to open new market opportunities for distributed solar.

A suite of bills enacted in Maryland increase the aggregate capacity limit for net metering in the state, authorize meter aggregation in net metering for local governments, and allow community solar participants to retain their subscription when they change their address. Lawmakers in New Mexico established a community solar program in the state, while the Washington legislature authorized the Utilities and Transportation Commission to approve discounts for low-income customers participating in community solar. West Virginia, meanwhile, legalized the use of third-party power purchase agreements in the state.

Grid Modernization

As of mid-June 2021, state lawmakers have introduced 339 bills related to grid modernization, energy storage, and regulatory reform, 38 of which have been enacted. An additional 32 bills have passed at least one chamber. Virginia had the busiest legislative session by far, enacting a whopping 12 bills related energy storage and grid modernization. Among the new laws are sales tax and property tax incentives for energy storage, a directive for 100% carbon-free electricity by 2040, and the establishment of the Virginia Solar Energy Development and Energy Storage Authority to further development of these resources.

Another hot topic among state legislatures this year has been utility business model reform, and wholesale markets specifically. Nevada legislators passed a bill requiring the state to join a regional transmission organization (RTO) by 2030, while the Oregon Legislative Assembly enacted a bill initiating a study of the benefits, opportunities, and challenges posed by the development or expansion of an RTO in the state. Connecticut lawmakers also passed notable legislation establishing a 1,000 MW energy storage target, to be achieved by December 31, 2030.

Electric Vehicles 

As of mid-June 2021, state lawmakers have introduced 462 bills related to the electrification of transportation, 59 of which have been enacted. An additional 54 bills have passed at least one chamber. As with the other technology categories, Maryland and Virginia had productive legislative sessions for electric vehicles, each enacting 6 bills. Among Virginia’s enacted legislation are bills creating rebate and grant programs for electric vehicles.

Other states also adopted meaningful legislation though, including Arkansas, which reduced its annual registration fee for hybrid vehicles, exempted vehicles registered to military service members from the annual registration fee, and established an EV Infrastructure Grant Program for Level 2 and DC fast charging facilities. Kansas, North Dakota, and South Carolina, meanwhile, clarified that electric vehicle charging stations are not public utilities and not subject to regulation by their respective state regulatory commissions. South Carolina’s legislation also establishes a Joint Committee on the Electrification of Transportation, which is to study and make recommendations regarding transportation electrification in the state.

* * *

Stay up to date on proposed legislation with DSIRE Insight’s 50 States of Solar, Grid Modernization, or Electric Vehicles quarterly reports, or with DSIRE Insight’s biweekly legislative and regulatory tracking services, included in all Single-Tech, All-Tech, and All-Access subscriptions. Learn more here, or contact us to discuss subscription options.

Status of State Net Metering Reforms

By: DSIRE Insight Team

State policymakers and regulators are continuing to consider major reforms to net metering policies, with states taking different approaches to successor tariff designs and implementation timelines. The NC Clean Energy Technology Center has tracked these changes for several years through its 50 States of Solar quarterly report series. To date, more than half of U.S. states have considered significant net metering reforms through legislation or regulatory proceedings. However, the majority of states continue to offer “traditional” or “retail rate” net metering that nets production and consumption over the monthly billing period.

Alternatives to Traditional Net Metering

Currently, eight states - Arizona, Hawaii, Indiana, Louisiana, Michigan, Mississippi, and Utah - have distributed generation (DG) compensation rules other than retail rate net metering. The predominant successor tariff structure is net billing, wherein production and consumption are netted at a sub-monthly interval (most net billing tariffs use instantaneous netting). Each of the above states offers a net billing tariff, although the credit rate for excess generation varies.

Net Metering and Distributed Generation Compensation Policies (May 2021)

NEM-Map-May2021.PNG

New York also has a net billing tariff in place for larger commercial customer-generators, as well as remote net-metered and community solar projects. This tariff compensates customers at a rate based on the value of distributed energy resources for hourly grid exports. Residential and small commercial customers are still eligible for retail rate net metering in New York, though.

Minor Modifications to Traditional Net Metering

Other states have considered significant net metering reforms, but opted to make only minor policy changes and maintain monthly netting, for at least the time being. California was one of the first states to consider a net metering successor tariff, and opted to retain monthly netting, but require participation in time-of-use rates and the application of certain non-bypassable charges.

Most recently, regulators in Kentucky and South Carolina issued orders maintaining monthly netting while modifying some other aspects of net metering. The Kentucky Public Service Commission issued a decision on Kentucky Power’s net metering successor proposal, making only a minor change to the tariff by reducing the credit rate for monthly net excess generation from the retail rate to $0.09746 per kWh. In South Carolina, regulators approved mandatory time-of-use rates for residential solar customers. The tariff will use monthly netting by time-of-use period and include a minimum bill. Duke Energy’s tariff will also include a non-bypassable charge based on system capacity, as well as a grid access fee based on system capacity for systems over 15 kW. The Connecticut Public Utilities Regulatory Authority also issued a decision in 2021, approving a traditional net metering option, as well as a buy-all, sell-all tariff option.

Net Metering Successor Tariffs and Modified Net Metering Programs

State

Year of Decision

Netting Interval

Excess Generation Credit Rate

Fees

AR

2020

Monthly

Retail rate

Grid Access Fee for larger customers (currently set at zero)

AZ

2016

Instantaneous

Phasing down to avoided cost

DG Grid Access Fee or On-Peak Demand Charge

CA

2016

Monthly

Retail TOU rates

Non-bypassable charges

CT

2021

Monthly

Retail rate

Utilities are to file non-bypassable charge designs by 1/1/2022

Buy-All/Sell-All

Fixed sell-all rate not yet determined

Utilities are to file non-bypassable charge designs by 1/1/2022

HI

2015, 2017

Instantaneous

Avoided cost rate

None

IN

2017 / 2021 (Vectren)

Instantaneous

1.25 times avoided cost (2.772 cents per kWh for Vectren)

None

KY

2021 (KY Power)

Monthly

9.746 cents/kWh

None

LA

2019

Instantaneous

Avoided cost rate

None

MI

2018

Instantaneous

Power supply rate

None

MS

2015

Instantaneous

Avoided cost rate plus non-quantifiable expected benefits adder (2.5 cents per kWh)

None

NH

2016

Monthly

Retail rate

Non-bypassable charges

NY

2020 (Mass Market)

Monthly

Retail rate

Monthly Customer Benefit Contribution based on DG system capacity

2017 (VDER)

Hourly

Value of DER rate

Monthly Customer Benefit Contribution based on DG system capacity

SC

2021

Monthly

Retail TOU rates

Minimum bill, non-bypassable charge based on DG system capacity, & grid access fee based on DG system capacity (for systems >15 kW)

UT

2020

Instantaneous

Summer: 5.817 cents/kWh; Winter: 5.487 cents/kWh

None

VT

2017

Monthly

Retail rate with credit adjustors

None

Regulators in Arkansas and New York issued decisions on net metering successor tariffs last year. The Arkansas Public Service Commission elected to maintain retail rate net metering, but approved a grid access fee, which is currently set at zero, for certain larger systems. The New York Public Service Commission, meanwhile, approved a mass market successor tariff design, which also maintains retail rate net metering while adopting a monthly customer benefit contribution based on DG system size.

New Hampshire and Vermont modified their net metering tariffs a few years ago, with the New Hampshire Public Utilities Commission adjusting credits for monthly net excess generation and Vermont regulators adopting credit adjusters based on system size, siting, and renewable energy certificate ownership.

Net Metering Reversals

Notably, some states that have adopted net metering successor tariffs have later reversed these decisions and returned to a monthly, retail rate netting structure. In Nevada, regulators adopted a net billing tariff with avoided cost compensation for excess generation in 2015. However, in 2017, the state legislature restored traditional net metering. Similarly, Maine regulators approved a buy-all, sell-all tariff to replace net metering, with compensation rates phasing down to an avoided cost rate. The state legislature later restored traditional net metering in 2019. Most recently, the Kansas Corporation Commission modified Evergy’s DG customer tariff so that it now includes the same rates as the standard customer tariff and no longer includes a demand charge component. This follows an opinion from the Kansas Supreme Court, finding that the tariff was discriminatory and in violation of state law.

Opening the Door to Reforms Down the Road

A growing number of states are opting to keep traditional net metering in place for at least a certain period of time, providing a degree of certainty to the market, but opening the door to policy reforms several years down the road. Oftentimes, these states will set a specific date or level of installed DG capacity that triggers a review of net metering and the development of a new tariff design.

In Arkansas, utilities and other stakeholders may file net metering alternatives beginning in 2023, and in Iowa, regulators are to develop a value of solar methodology for future tariffs in 2027. Virginia and Washington lawmakers both enacted legislation increasing the states’ aggregate caps on net metering, while establishing successor tariff timelines. In Virginia, the State Corporation Commission is to open a successor tariff proceeding when the aggregate capacity of customer-generators reaches 3% for a utility. In Washington, utilities may file net metering successor tariffs to take effect when the 4% aggregate capacity limit is reached or July 1, 2029, whichever comes first.

Reforms Currently Under Consideration

Several states are in the midst of evaluating major net metering reforms. California regulators are in the process of developing a Net Metering 3.0 tariff, while the Illinois Commerce Commission is determining the DG rebate amount that will be a component of the state’s net metering successor tariff.

In Hawaii, the Public Utilities Commission is considering DG rate design proposals, including HECO’s proposal to implement a time-varying export credit rider. The Michigan Public Service Commission is also considering further changes to its inflow/outflow tariff through a working group focused on rate design for distributed energy resources. Mississippi regulators are also evaluating net metering changes in a new proceeding opened this year.

Energy Storage at Electric Cooperatives: State and Local Policy Factors

By: DSIRE Insight Team

The NC Clean Energy Technology Center (NCCETC) has been working with the Solar-Plus for Electric Cooperatives (SPECs) project, part of the National Renewable Energy Laboratory’s Solar Energy Innovation Network, to help develop resources to assist rural electric cooperatives to procure energy storage. The SPECs project period is ending later in Spring 2021, and the project team is preparing to publish resources. These include an economic modeling software package, procurement process guidance documents, and a white paper reviewing policy and institutional factors that affect storage deployment at cooperatives. DSIRE Insight team member David Sarkisian has led the SPECs research for the policy review, and identified several state and local policy factors relevant to energy storage at electric cooperatives, which are discussed below. Please check the NCCETC and SPECs project websites later this spring to see the full white paper and other resources.

As energy storage has become a more significant factor in the U.S. electric system, policy at all levels has started to adjust in order to take account of energy storage’s unique characteristics. Because of their unique institutional status, and in some cases, their isolation from larger electricity markets, rural electric cooperatives often appear insulated from policy changes that affect other utilities. However, many types of policy do affect cooperatives, whether through direct requirements and incentives or through indirect effects on other electricity market institutions and the broader electric system.

Deployment Requirements

Many states have requirements for utility deployment of renewable energy resources; typically, those requirements have come in the form of a Renewable Portfolio Standard, or RPS.[1] The application of RPS policies to electric cooperatives is often different than for investor-owned utilities. Some state renewable portfolio standards require deployment actions from cooperative utilities, which can lead to exceptions in wholesale contract all-requirements provisions. Additionally, as energy storage is not, in itself, a renewable generation resource, RPS policies’ interaction with storage deployment can differ between states. Some states have adopted policies targeting deployment of energy storage specifically.[2] As with RPS policies, the requirements imposed by these policies may be different for cooperatives than for other utilities; for instance, one state with aggressive storage deployment targets, New York, does not apply them to its cooperative utilities, which are relatively small and few in number.

Incentives

States have adopted tax credits, exemptions, and other incentives for deployment of energy storage. Some of these incentives are not directly applicable to electric cooperatives due to their non-profit status, although organizational arrangements exist that can allow cooperatives to indirectly benefit from income tax incentives. Other incentive programs have been designed to flow through large, typically investor-owned utilities, limiting their applicability to electric cooperatives.

Clean Peak Policies

A few states have adopted or considered “clean peak” policies, which aim to increase the amount of renewable energy being used to meet demand during peak times. As many renewable energy sources are not able to be dispatched on demand without storage support, energy storage plays an important role in complying with clean peak standards. Clean peak policies are similar to RPS policies in that they require a certain percentage of electricity to come from renewable or carbon-free sources, except that for clean peak policies this pertains specifically to electricity consumed during peak times.

The only state that has so far adopted a clean peak standard is Massachusetts, which adopted the policy in March 2020. Arizona and California have also considered clean peak standards. Compliance with Massachusetts’ clean peak policy requires that utilities purchase a certain percentage of their electricity from resources designated as clean peak resources; as the designation of these resources is done by state regulators, utilities do not have to manage their own peaking resources to comply with the policy. Massachusetts does not have electric cooperatives, and does not apply the Clean Peak Standard policy to municipal utilities.

Utility Compensation Policies

State policies for utility compensation of energy storage and other distributed resources pertain mostly to projects installed by customers of electric cooperatives rather than projects installed by cooperatives themselves. However, these policies can potentially affect utility programs that involve customer-owned storage.

Compensation policies here refers to policies like net metering and Public Utility Regulatory Policies Act (PURPA) contract rules that govern how utilities must pay for electricity supplied by customers or other alternative suppliers. State net metering policies do not always apply to electric cooperatives, or may be different for cooperatives than for investor-owned utilities. States that have considered the issue have generally ruled that paired solar and storage facilities are eligible for net metering, although some states, like Hawaii and New York have introduced separate policies for compensation of paired systems in order to manage storage’s ability to draw electricity from the grid.

Resource Planning

Some states require utilities to undertake a process called Integrated Resource Planning (IRP) in order to allow for regulatory commission review of utilities’ longer-term plans for electricity supply. In states that require IRP, the rules do not always apply to cooperative utilities; some states also require utilities to create resource plans, but do not require regulatory approval of these plans. IRPs may also be required for customers of power marketing administrations; customers of the Western Area Power Administration, for example, are required to submit IRPs every five years. Even in areas where cooperatives are required to submit IRPs, these requirements may be more stringent for Generation & Transmission (G&T) utilities than for distribution utilities, as many distribution utilities have few generation assets. This does not mean that distribution cooperatives that meet IRP requirements through their G&T provider should ignore IRP policies; the requirements that IRP policies place on G&T utilities may have significant implications for G&T interactions with their distribution partners. Some state regulatory commissions have required utilities undergoing the IRP process to more thoroughly consider storage as well as other resources available at the distribution level.

Distribution System Planning

As an analogue to generation resource planning processes, some states have begun to implement requirements for long-term planning of the distribution system. As most rural electric cooperatives operate on the distribution scale, distribution system planning may apply to them more directly than does integrated resource planning. As with other types of policy, though, distribution system planning requirements may be different for cooperatives than for other utilities. Energy storage’s capability to be used at both the generation and transmission system and as a distribution system-level resource means that storage can be incorporated into distribution system plans as well as integrated resource plans.

Local Permitting and Zoning

Electric cooperatives are often located in rural areas and therefore might be thought to face fewer obstacles regarding local land use than other utilities and storage developers in more densely populated areas. However, land use issues can still be an important consideration for cooperatives in considering storage deployment, particularly when paired with solar or other generation resources that use a relatively large amount of land.

Paired solar and storage facilities may need to undergo permitting processes at both the state and local levels, although facilities below a certain size can be exempted from some elements of the permitting process. For instance, Virginia has a less strict permitting process for solar facilities below 5 MW in capacity. However, local permitting processes still apply, and local residents with concerns about impacts on agricultural land use or amenity value may present obstacles for these projects. Electric cooperatives are often uniquely situated to create programs that share benefits with local stakeholders, which may let them ameliorate local opposition to solar and storage development.

[1] Database of State Incentives for Renewables and Efficiency (DSIRE). (2020, September). Renewable and Clean Energy Standards. North Carolina Clean Energy Technology Center. https://ncsolarcen-prod.s3.amazonaws.com/wp-content/uploads/2020/09/RPS-CES-Sept2020.pdf

[2] Database of State Incentives for Renewables and Efficiency (DSIRE). (2020, April). Energy Storage Targets. North Carolina Clean Energy Technology Center. https://ncsolarcen-prod.s3.amazonaws.com/wp-content/uploads/2020/04/DSIRE_Storage_Targets_April2020.pdf

2021 Legislative Update: Solar, Energy Storage, and Electric Vehicles on the Agenda

By: DSIRE Insight Team

With state legislative sessions in full swing, the DSIRE Insight team has been busy tracking proposed legislation related to distributed solar, grid modernization, and electric vehicles (specifically examining the topics tracked in the 50 States reports). As of mid-March 2021, at over 600 bills were under consideration across 46 states, with 10 of these bills being enacted so far.

Number of Distributed Solar, Grid Modernization, & Electric Vehicle Bills Under Consideration (As of Mid-March 2021)

Legislation-Mar2021.PNG

Distributed Solar

As of mid-March 2021, state lawmakers were considering at least 111 bills related to net metering, community solar, third-party ownership, and distributed generation rate design.

Several bills have passed one legislative chamber so far, including a Montana bill increasing the net metering size limit for non-residential projects and a Wyoming bill directing the Public Service Commission to develop a net metering successor tariff.

The New Mexico Senate has passed a bill establishing a community solar program, and multiple bills introduced in Florida would authorize third-party ownership of solar energy systems for educational and public entities.

Top Solar, Grid Modernization, & Electric Vehicle Topics Addressed by Proposed Legislation (As of Mid-March 2021)

LegislationChart-Mar2021.PNG

Grid Modernization

As of mid-March 2021, state legislators were considering at least 227 bills related to grid modernization, energy storage, and regulatory reform.

In Virginia, state lawmakers enacted bills adopting sales and property tax exemptions for certain energy storage systems. State legislatures in a number of other states, including Arizona, Indiana, South Carolina, and Texas, are also considering sales or property tax exemptions for storage projects.

The New Mexico State House passed a bill creating an energy storage income tax credit for residential systems. Legislation introduced in Maine would establish an energy storage target, and an Illinois bill calls for a move to performance-based ratemaking and a new multi-year integrated grid planning process.

Proposed Legislation Under Consideration by Topic (As of Mid-March 2021)

LegislationTopics-Mar2021.PNG

Electric Vehicles

As of mid-March 2021, state lawmakers were considering at least 319 bills related to electric vehicles and charging infrastructure.

The New Hampshire Senate passed an expansive bill including state zero-emission vehicle procurement requirements, registration fees for electric vehicles, and rate design guidelines for electric vehicle charging. Legislation passed by the Missouri Senate increases electric vehicle registration fees, while the South Dakota legislature enacted a bill establishing a new registration fee for all-electric vehicles.

A North Dakota bill unanimously passed by the House and Senate would exempt electric vehicle charging station owners from public utility regulation as long as the electricity being resold was procured from the utility. Bills passed in Virginia create an electric vehicle rebate program and an electric vehicle grant program.

* * *

To keep up with proposed legislation across the country, check out the 50 States of Solar, 50 States of Grid Modernization, and 50 States of Electric Vehicles reports for quarterly updates or DSIRE Insight’s other subscription offerings for biweekly legislative tracking.

Community Solar Policy Update: States Exploring Low-Income Access and New Program Models

By: DSIRE Insight Team

Community solar has emerged as a popular policy option for states aiming to expand access to solar energy. Community solar programs allow customers to purchase solar-generated electricity from off-site solar facilities through subscriptions or upfront payments, giving people who cannot or prefer not to install rooftop solar a way to participate in the solar economy. Community solar subscriptions involve payments for electricity from specific facilities, which are typically located in the same local jurisdiction as the subscribers; as such, they can be differentiated from programs like green tariffs, which allow customers to buy renewable electricity but usually do not identify specific facilities and have looser location requirements. 

As community solar has grown as a segment of the solar market, state policymakers have taken interest, and several states have made community solar an important part of their overall solar policy framework. As of February 2021, 23 states and the District of Columbia have statewide policies enabling at least some form of community solar, and many other states have authorized specific community solar programs proposed by utilities. This post highlights some trends in community solar policy that have emerged recently as community solar has become a major part of the solar landscape.

State Community Solar Policies (February 2021)

community-solar-map-Feb2021.PNG

Low-Income and Multifamily Access

State policymakers, throughout 2020 as well as in the early part of 2021, have shown an interest in modifying community solar programs to make them more accessible and advantageous to lower-income households and people living in multifamily dwellings. For example, in July 2020 Colorado’s Public Utilities Commission approved new rules for the state’s Community Solar Gardens program. The new rules expand access to the program for operators of affordable housing, facilitate donations of bill credits to lower-income customers, and remove limitations requiring subscribers to live in the same or adjacent counties to their community solar facility. 

New York’s Public Service Commission approved a proposal from the New York State Energy Research and Development Authority (NYSERDA) to create a Framework for Solar Energy Equity, which will direct additional funding from the NY-SUN program to projects that benefit lower-income people and communities. Virginia lawmakers passed legislation creating new shared solar programs for Dominion Energy, the state’s largest investor-owned utility. One of these programs includes a 30% program carve-out for lower-income customers, and another specifically enables shared solar programs for multifamily dwellings. 

So far in 2021, Illinois legislators have proposed numerous policy changes involving community solar as part of the Clean Jobs, Workforce, and Contractor Equity Act. This bill directs state programs which procure renewable energy credits from community solar projects to ensure that lower-income people have access to job opportunities in the construction of the projects. The bill also reserves some funds for support of community solar projects that are at least partially owned by lower-income residents, affordable housing owners, or organizations providing community services. Overall the bill has an emphasis on encouraging community ownership and governance of community solar facilities, which stands in contrast with the utility-led community solar model that has become prevalent in many states.

New Program Models

States have also been considering new programs that differ from the traditional community solar model, but that share the overall goal of providing wider access to the economic benefits of solar energy. New York in particular has been a hotbed for new program models. New York recently adopted a new program which, though not a community solar program by the traditional definition, offers a new model for sharing the benefits of solar more broadly. The Host Community Benefit program will require developers of large solar (and wind) projects to provide payments to residents of municipalities where the projects are located. The payments will be made through electric utilities and will be distributed on residents’ electric bills. 

Also in New York, two municipalities are preparing to launch a pilot “opt-out” community solar program in collaboration with Joule Community Power, an independent power provider active in the Community Choice Aggregation market. This program, referred to as Community Choice Solar, avoids many of the traditional participation barriers for community solar programs by automatically enrolling residents in the program, with an option to leave. The program was approved by the New York Department of Public Service in September 2020. 

Utility-Led Programs

Community solar has made an impact even in states without formal community solar policy. Utilities in some states have chosen to offer community solar programs without a legislative mandate to do so. Florida Power & Light’s SolarTogether program is an example of this approach. Through this program, approved by state regulators in 2020, Florida Power & Light is building 1.49 GW of solar capacity and offering it to customers through subscriptions. The program requires an upfront payment as well as monthly subscription payments, and provides monthly bill credits based on the value of the solar generation. Unlike many other utility-led programs, SolarTogether is projected to eventually provide a net bill reduction for subscribers, rather than requiring a perpetual “premium” for solar electricity. The first six solar plants to enter service through SolarTogether have already been fully subscribed; additional facilities are scheduled to begin operation in 2021.

Many municipal utilities and electric cooperatives have also created community solar programs in states without formal requirements. In North Carolina, a legislatively-mandated community solar program for the investor-owned Duke Energy utilities has yet to begin, but Fayetteville Public Works Commission (a municipal utility) and several members of the North Carolina Electric Membership Corporation already have community solar programs up and running. The Fayetteville program, like the SolarTogether program in Florida, expects to be able to provide subscribers with a net bill reduction over time. 

* * *

Learn more about community solar policy changes under consideration with the 50 States of Solar quarterly reports, or DSIRE Insight’s Solar Single-Tech Subscription service. Contact us for more information or to request subscription samples.

Stimulus Bill Extends Federal Energy Tax Credits

By: DSIRE Insight Team

In a nearly annual tradition, Congress made a number of important changes to the tax code in the waning days of 2020. The Taxpayer Certainty and Disaster Relief Act of 2020 extended the expiration date of a number of tax incentives, giving system owners and developers additional time to place their systems in service or begin construction.

Investment Tax Credit

Legislation enacted in previous years established a step-down in the credit amounts for the Business Energy Investment Tax Credit (ITC). The deadlines for solar systems were extended by two years. Projects placed in service before December 31, 2022 will qualify for a tax credit based on 26% of the installed cost. Projects placed in service before December 31, 2024 will qualify for a 22% tax credit, before permanently dropping to 10%. Projects started before the end of 2024 and placed in service before the end of 2026 will also be eligible for a 22% tax credit.

The amendments to the ITC also made offshore wind projects eligible for the credit. Offshore wind projects started before the end of 2025 can qualify for a full 30% tax credit. The Residential Renewable Energy Tax Credit has a similar step-down schedule, except the credit phases out entirely for system installed in 2024 or later.

Federal Investment Tax Credit Step-Down Schedule for Solar Energy Systems

ITC-Graph-2020.PNG

Production Tax Credit

The Renewable Electricity Production Tax Credit (PTC) was also modified in recent years to include a step-down for wind systems, and an expiration date for all systems requiring construction to start by the end of 2020. The new deadline established by the 2020 stimulus bill is the end of 2021. Wind projects started in 2020 or 2021 can qualify for a production tax credit based on 60% of the full rate. Interestingly, the step-down was not applied to the other PTC-eligible technologies, including biomass, landfill gas, waste heat to energy, and certain hydroelectric systems. Instead, the PTC for these systems was initially allowed to expire. When they were later reinstated, the step-down was not applied to them. Thus, the extended expiration date for these technologies allows such projects started by the end of 2021 to claim the full PTC.  

Energy Efficiency Tax Credits

The expiration date for the Residential Energy Efficiency Tax Credit and the Energy-Efficient New Homes Tax Credit for Home Builders were both extended by a year, making eligible projects completed by the end of 2021 eligible. And the Energy-Efficient Commercial Buildings Tax Deduction was made permanent with the exact value of the deduction being adjusted annually for inflation. 

* * *

Visit the Database of State Incentives for Renewables and Efficiency (DSIRE) for more information on federal and state incentives for renewable energy energy efficiency technologies. View DSIRE Insight offerings to stay on top of state policy changes.

2020 Federal and State PURPA Updates

By: DSIRE Insight Team

This month’s blog post focuses on state and federal policy changes concerning the Public Utilities Regulatory Policy Act, or PURPA. PURPA requires electric utilities to purchase electricity from small renewable or cogeneration facilities, termed Qualifying Facilities, or QFs, at the utilities’ avoided cost of electricity. While PURPA is a federal law, states have a large role in PURPA policy, with states largely responsible for determining how avoided costs are calculated and setting PURPA contract terms. Differences in state PURPA implementation can have a large effect on patterns of renewable development across states.

PURPA policy has seen some major changes since our last PURPA blog post, most notably the issuance of Federal Energy Regulatory Commission (FERC) Order 872, which significantly adjusts state and utility obligations under PURPA, primarily in the direction of limiting the size and type of QFs that are required to be served through PURPA contracts. Some states have begun revising their own PURPA rules following Order 872. FERC and the states have also continued to grapple with other policy questions, including how energy storage fits into the PURPA framework.

States Considering Changes to PURPA Implementation, Jan. 2020 - Dec. 2020

PURPA-Map-2020.PNG

Major Developments:

FERC Order 872

FERC Order 872, issued in July 2020, makes several significant changes to PURPA implementation requirements. The order followed from a Notice of Proposed Rulemaking (NOPR) issued in September 2019 and contains many of the same elements, although Order 872 did not adopt all of the changes proposed in the NOPR. Order 872’s changes generally go in the direction of limiting the availability of PURPA contracts. Major elements include:

  • Reducing the maximum system size at which access to competitive markets is presumed from 20 MW to 5 MW.

  • Adopting a rebuttable presumption that locational marginal prices (LMPs) established through competitive procurement processes reflect utility avoided costs.

  • Revisions to the language determining whether facilities located nearby to each other are part of the same QF.

  • A requirement that QFs demonstrate commercial viability and financial commitment before being entitled to a contract or legally enforceable obligation (LEO).

  • Allowing states to require that PURPA contracts include avoided costs that vary over time (rather than being set at a fixed price) and allowing states to use projected energy costs in determining avoided costs.

The NOPR had proposed several additional elements, which were either not included in Order 872 or significantly scaled back. These included:

  • A provision allowing utilities to reduce PURPA obligations through use of retail choice programs.

  • A larger decrease to the maximum system size at which access to competitive markets is presumed (to 1 MW rather than 5 MW).

  • Adoption of a per se rule (rather than a rebuttable presumption as in the order) that LMPs reflect avoided costs.

States will adjust their PURPA regulations in order to adopt the changes required or allowed by Order 872. Several states, including Colorado, Michigan, Missouri, and New Mexico, have already opened new dockets or incorporated discussion of Order 872 into existing PURPA dockets.

QF + Storage Combinations 

As the role of energy storage in the electricity system has grown, questions about how PURPA applies to combinations of renewable generation and storage have emerged. 

FERC recently had the opportunity to address this issue in case QF17-454, concerning a solar-plus-storage facility in Montana. However, FERC elected to resolve this case without ruling on the storage question; the matter was decided based on the size of the solar element alone. The ruling does have implications for QFs more broadly, as it indicates that QF capacity is determined through the “power production capacity” of the QF rather than the capacity that it is capable of providing to the grid at any one time (the facility in question has 160 MW of solar PV capacity, but its inverter only allows 80 MW to be supplied to the grid). 

State regulatory commissions have also been considering storage treatment under PURPA. Idaho regulators adopted rules in October 2020 for QFs that include storage. The rules establish a separate category for storage systems with less than 100 kW of capacity, with QFs in this category eligible for 20-year standard contracts. Systems above 100 kW in capacity can receive 2-year contracts. The avoided cost methodology to be used to compensate capacity for larger storage systems is based on a methodology developed by Duke Energy.

* * * 

Learn more about PURPA changes under consideration or current investor-owned utility avoided cost rates through our DSIRE Insight PURPA and avoided cost offerings, which were recently updated in December 2020. For more information or to request a sample, email us at afproudl@ncsu.edu.