By: Autumn Proudlove, Sr. Policy Program Director
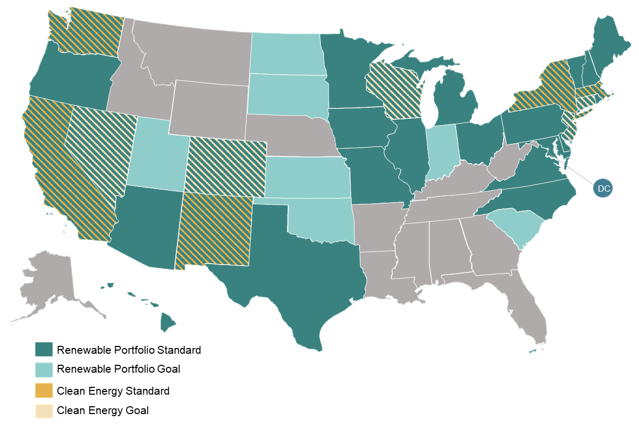
States continue to be very active on clean energy policy, with a growing focus on overall decarbonization of the electric power sector. Some of the most popular policy approaches to electric decarbonization are renewable portfolio standards, clean energy standards, and emissions reduction targets. Currently, 36 states and DC have a renewable portfolio standard or goal, while 10 states have a clean energy standard or goal. Numerous states have also adopted requirements or goals to reduce carbon or greenhouse gas emissions by a certain percentage. Some of these emissions reduction policies apply to the electricity sector specifically, while others apply economy-wide.
State Renewable Portfolio Standards and Clean Energy Standards
Recent Activity
A number of states have recently considered legislation to increase their decarbonization targets or set new targets. The Hawaii State Legislature passed H.B. 1800 this year, which would adopt a statewide greenhouse gas emissions reduction target of 50% over 2005 levels by 2030. The bill is currently awaiting action by the Governor. In Rhode Island, H.B. 7277 and S.B. 2274 would increase the state’s renewable portfolio standard to 100% by 2033. The bills have been passed and are also awaiting action by the Governor. The Maryland General Assembly enacted the Climate Solutions Now Act of 2022 (S.B. 528) in April 2022, which adopts a target of net-zero statewide greenhouse gas emissions by 2045.
Current Clean Energy Generation by State (Data Source: U.S. Energy Information Administration)
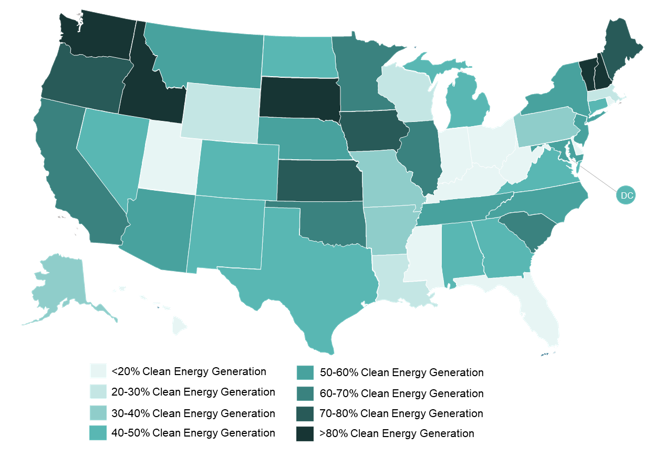
Current Clean Energy Generation
The amount of electricity being generated by clean sources varies significantly from state to state. The map above shows the percentage of electricity generation currently coming from clean energy sources, with data derived from the U.S. Energy Information Administration (Electric Power Monthly, Net Generation by State by Type of Producer by Energy Source, March 2022). The map represents the percent of total MWh generated in each state from nuclear, hydroelectric, solar, wind, biomass, and geothermal sources. The dominant clean energy resources also vary substantially from state to state. For example, hydropower is a major contributor in the Northwest and wind accounts for a large portion of generation in the Midwest and Plains states.
While states are at different stages of electric power decarbonization, the general policy trend across the U.S. has been toward more aggressive targets - increasing emission reduction or clean energy goals and speeding up the timeline for achieving these. Utilities themselves are also setting their own goals, as identified by the Smart Electric Power Alliance’s Carbon Reduction Tracker. With the majority of states having some type of a decarbonization target in effect, even many 100% clean energy or net-zero emissions goals, integrated resource planning and market rules will be important areas to watch as implementation of these policies unfolds.
* * *
The DSIRE Insight team is currently developing a new policy tracking report series - The 50 States of Decarbonization - which will track state decarbonization policy developments and utility planning. Sign up for our email list to be the first to know when the new series is available, or contact us to learn more.