By: Autumn Proudlove, Associate Director - Policy & Markets
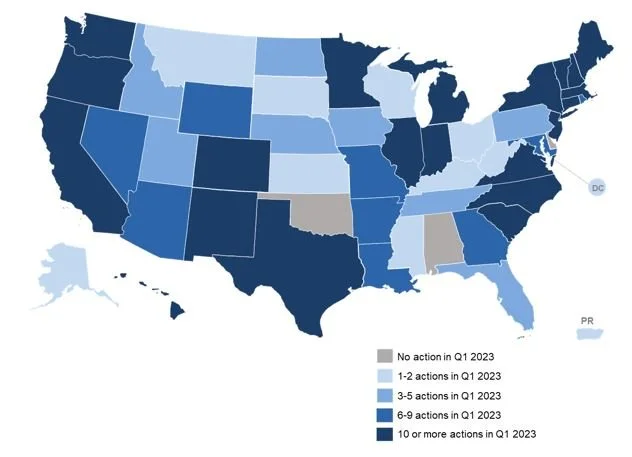
Earlier this month, our team released its very first 50 States of Power Decarbonization quarterly report, tracking state and utility actions related to clean energy and emission reduction targets, planning and procurement rules, utility integrated resource plans, and more during Q1 2023. This new publication is intended to help energy industry professionals keep up with the fast-paced activity happening in the electric power decarbonization space, while connecting the threads of state clean energy policies and utility resource planning and procurement. In the first quarter of the year, 47 states plus DC and Puerto Rico took actions related to power decarbonization and resource planning, with some highlights including Minnesota’s new requirement for 100% carbon-free electricity by 2040, New Jersey’s new goal of achieving 100% clean energy by 2035, and PacifiCorp filing its multi-state integrated resource plan that aims to add over 25,000 MW of wind, solar, and storage by 2042.
Q1 2023 Action on Power Decarbonization and Resource Planning
Power Decarbonization: Where We Are
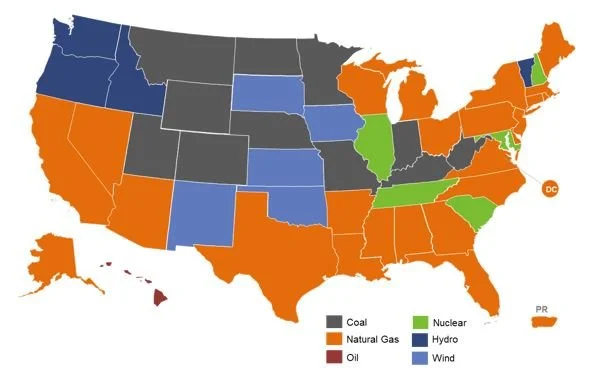
Largest Contributing Resource to State Electric Generation Mix (2022)
Data Source: U.S. Energy Information Administration – Electric Power Monthly, Net Generation by State by Type of Producer by Energy Source (Jan. – Dec. 2022).
The electric power sector in the U.S. is the second largest source of greenhouse gas emissions, behind the transportation sector, with a majority of its energy resources coming from fossil fuels. The industrial end-use sector is right behind it, followed by commercial and residential buildings. Together, these sectors account for approximately 90% of U.S. greenhouse emissions. While the electric power sector itself accounts for 25% of emissions, efforts underway to electrify transportation, buildings, and industrial processes amplify the impact of decarbonizing the power sector.
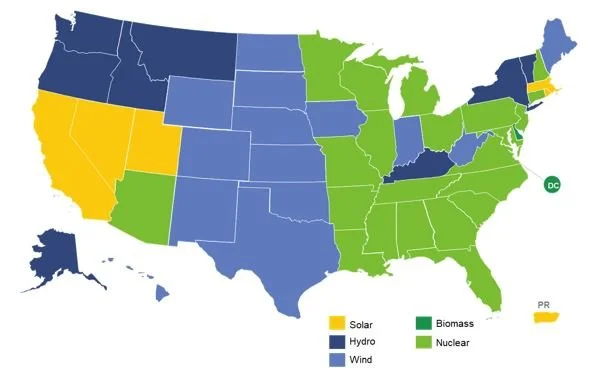
Largest Contributing Clean Resource to State Electric Generation Mix (2022)
Data Source: U.S. Energy Information Administration – Electric Power Monthly, Net Generation by State by Type of Producer by Energy Source (Jan. – Dec. 2022).
Currently, natural gas (39.8%) and coal (19.5%) are the dominant electric generation resources in the U.S., and either natural gas, coal, or oil makes up the largest share of electricity generation in 36 states (see image above). Despite the current dominance of fossil fuels, clean energy is becoming a mainstay in the nation’s energy mix, particularly as costs decline and states acquire cleaner resources to meet climate and other environmental objectives.
Nationwide, clean energy resources are currently led by nuclear (18.2%), followed by wind (10.2%), hydropower (6.2%), and solar (3.4%). Across the country, these resource mixes vary greatly, with different resources leading each state’s clean electricity generation; currently, most states’ clean energy portfolios are led by either nuclear or wind energy. The overall contribution of clean energy sources to states’ electricity generation also varies widely, ranging from 3% to 99% in 2022 (see image below).
Percentage of Clean Electricity Generated by State (2022)
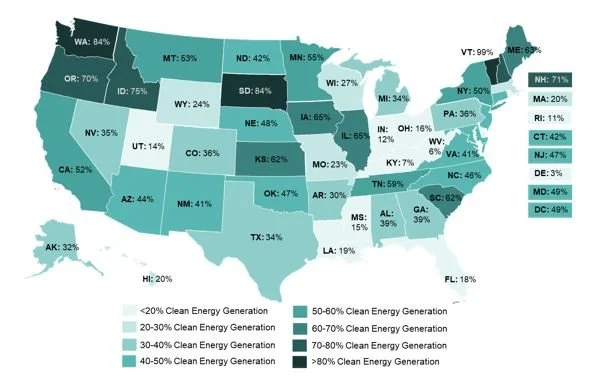
Data Source: U.S. Energy Information Administration – Electric Power Monthly, Net Generation by State by Type of Producer by Energy Source (Jan. – Dec. 2022). Map represents percent of total MWh generated in each state from clean energy sources (biomass, geothermal, hydroelectric, nuclear, solar, and wind).
Power Decarbonization: Where We Want to Go
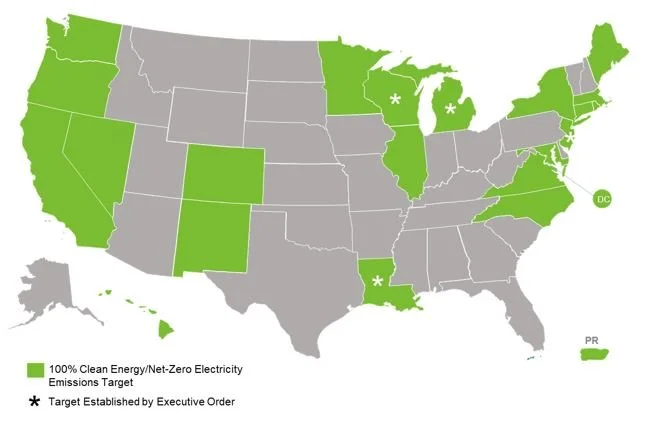
100% Clean Energy or Net-Zero Electricity Sector Emissions Targets (May 2023)
Current federal government goals have the U.S. attaining a carbon pollution-free power sector by 2035 and a net-zero economy by 2050. A total of 36 states currently have a renewable portfolio standard or goal in place (ranging from final targets of 2% to 100%), while 17 states have established broader clean energy standards or goals. As of now, 21 states have set clean or renewable energy targets to reach net-zero emissions by 2050 at the latest. However, the strength of these targets varies substantially - ranging from goals set by executive orders to mandatory requirements enacted through legislation. In addition, numerous electric utilities have announced net-zero or carbon neutrality goals for Scope 1, Scope 2 – and for some – Scope 3 emissions. Overall, these targets present a picture of where state and utility leaders would like us to go in terms of power decarbonization, and how quickly.
State Clean and Renewable Energy Targets (May 2023)
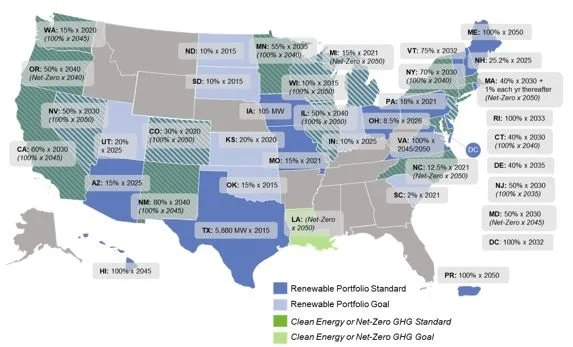
During Q1 2023, 32 states plus DC considered changes to clean energy standards, renewable portfolio standards, clean energy goals, and technology-specific standards. The majority of these actions involved increasing clean or renewable energy targets, moving up timelines for meeting existing targets, or clarifying resources eligible for compliance (particularly nuclear, biomass, and hydrogen technologies). Meanwhile, 22 states took actions related to emission reduction targets and other carbon policies, such as cap-and-trade systems or carbon taxes.
Power Decarbonization: Where We Are Heading
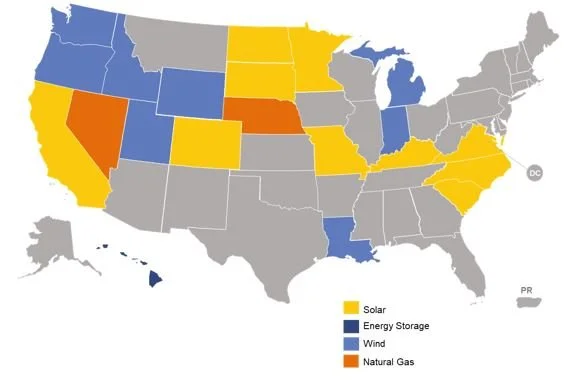
Utility IRP Action, by Largest Planned Resource Addition (Q1 2023)
Thirty-one states and Puerto Rico currently have formal integrated resource planning (IRP) requirements, where utilities must prepare a roadmap for meeting future electricity system needs. Of the resource plans currently pending approval or acknowledgement during Q1 2023, 25 contained energy storage capacity additions, 24 contained solar, 20 wind, and 10 natural gas. The largest planned resource additions in aggregate were solar (74,230.5 MW), wind (47,661.5 MW), storage (33,273 MW), and natural gas (14,950.6 MW). Solar and wind accounted for the largest supply-side resource additions in all but three states with an IRP or plan update under review during the quarter. Eighteen resource plans also contained coal capacity retirements, seven for natural gas, and four for oil.
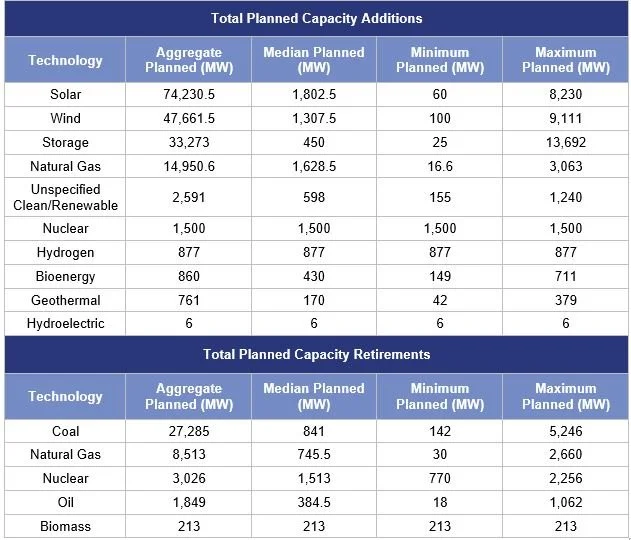
Total Planned Capacity Additions and Retirements, by Resource (Among Utility IRPs Under Review in Q1 2023)
Note: For median and minimum planned capacity, only IRPs that include any amount of the specified resource are considered in the calculation. Expiring contracts with generators are not included in capacity retirement figures.
Although there is much work to be done from where we currently stand to achieve state and utility power decarbonization goals, the future is looking bright. Power decarbonization is being actively considered by policymakers and regulators in nearly every state in the nation, and clean energy resources are dominating most states’ planned electric generation capacity additions in both the near-term and long-term. Meanwhile, states are working to create regulatory structures that will support the achievement of power decarbonization goals in the most fair and efficient ways.
* * *
The Q1 2023 50 States of Power Decarbonization is publicly available here. Future editions will be available for purchase for $500 or an annual subscription price of $1,500.